Read the Overview tab
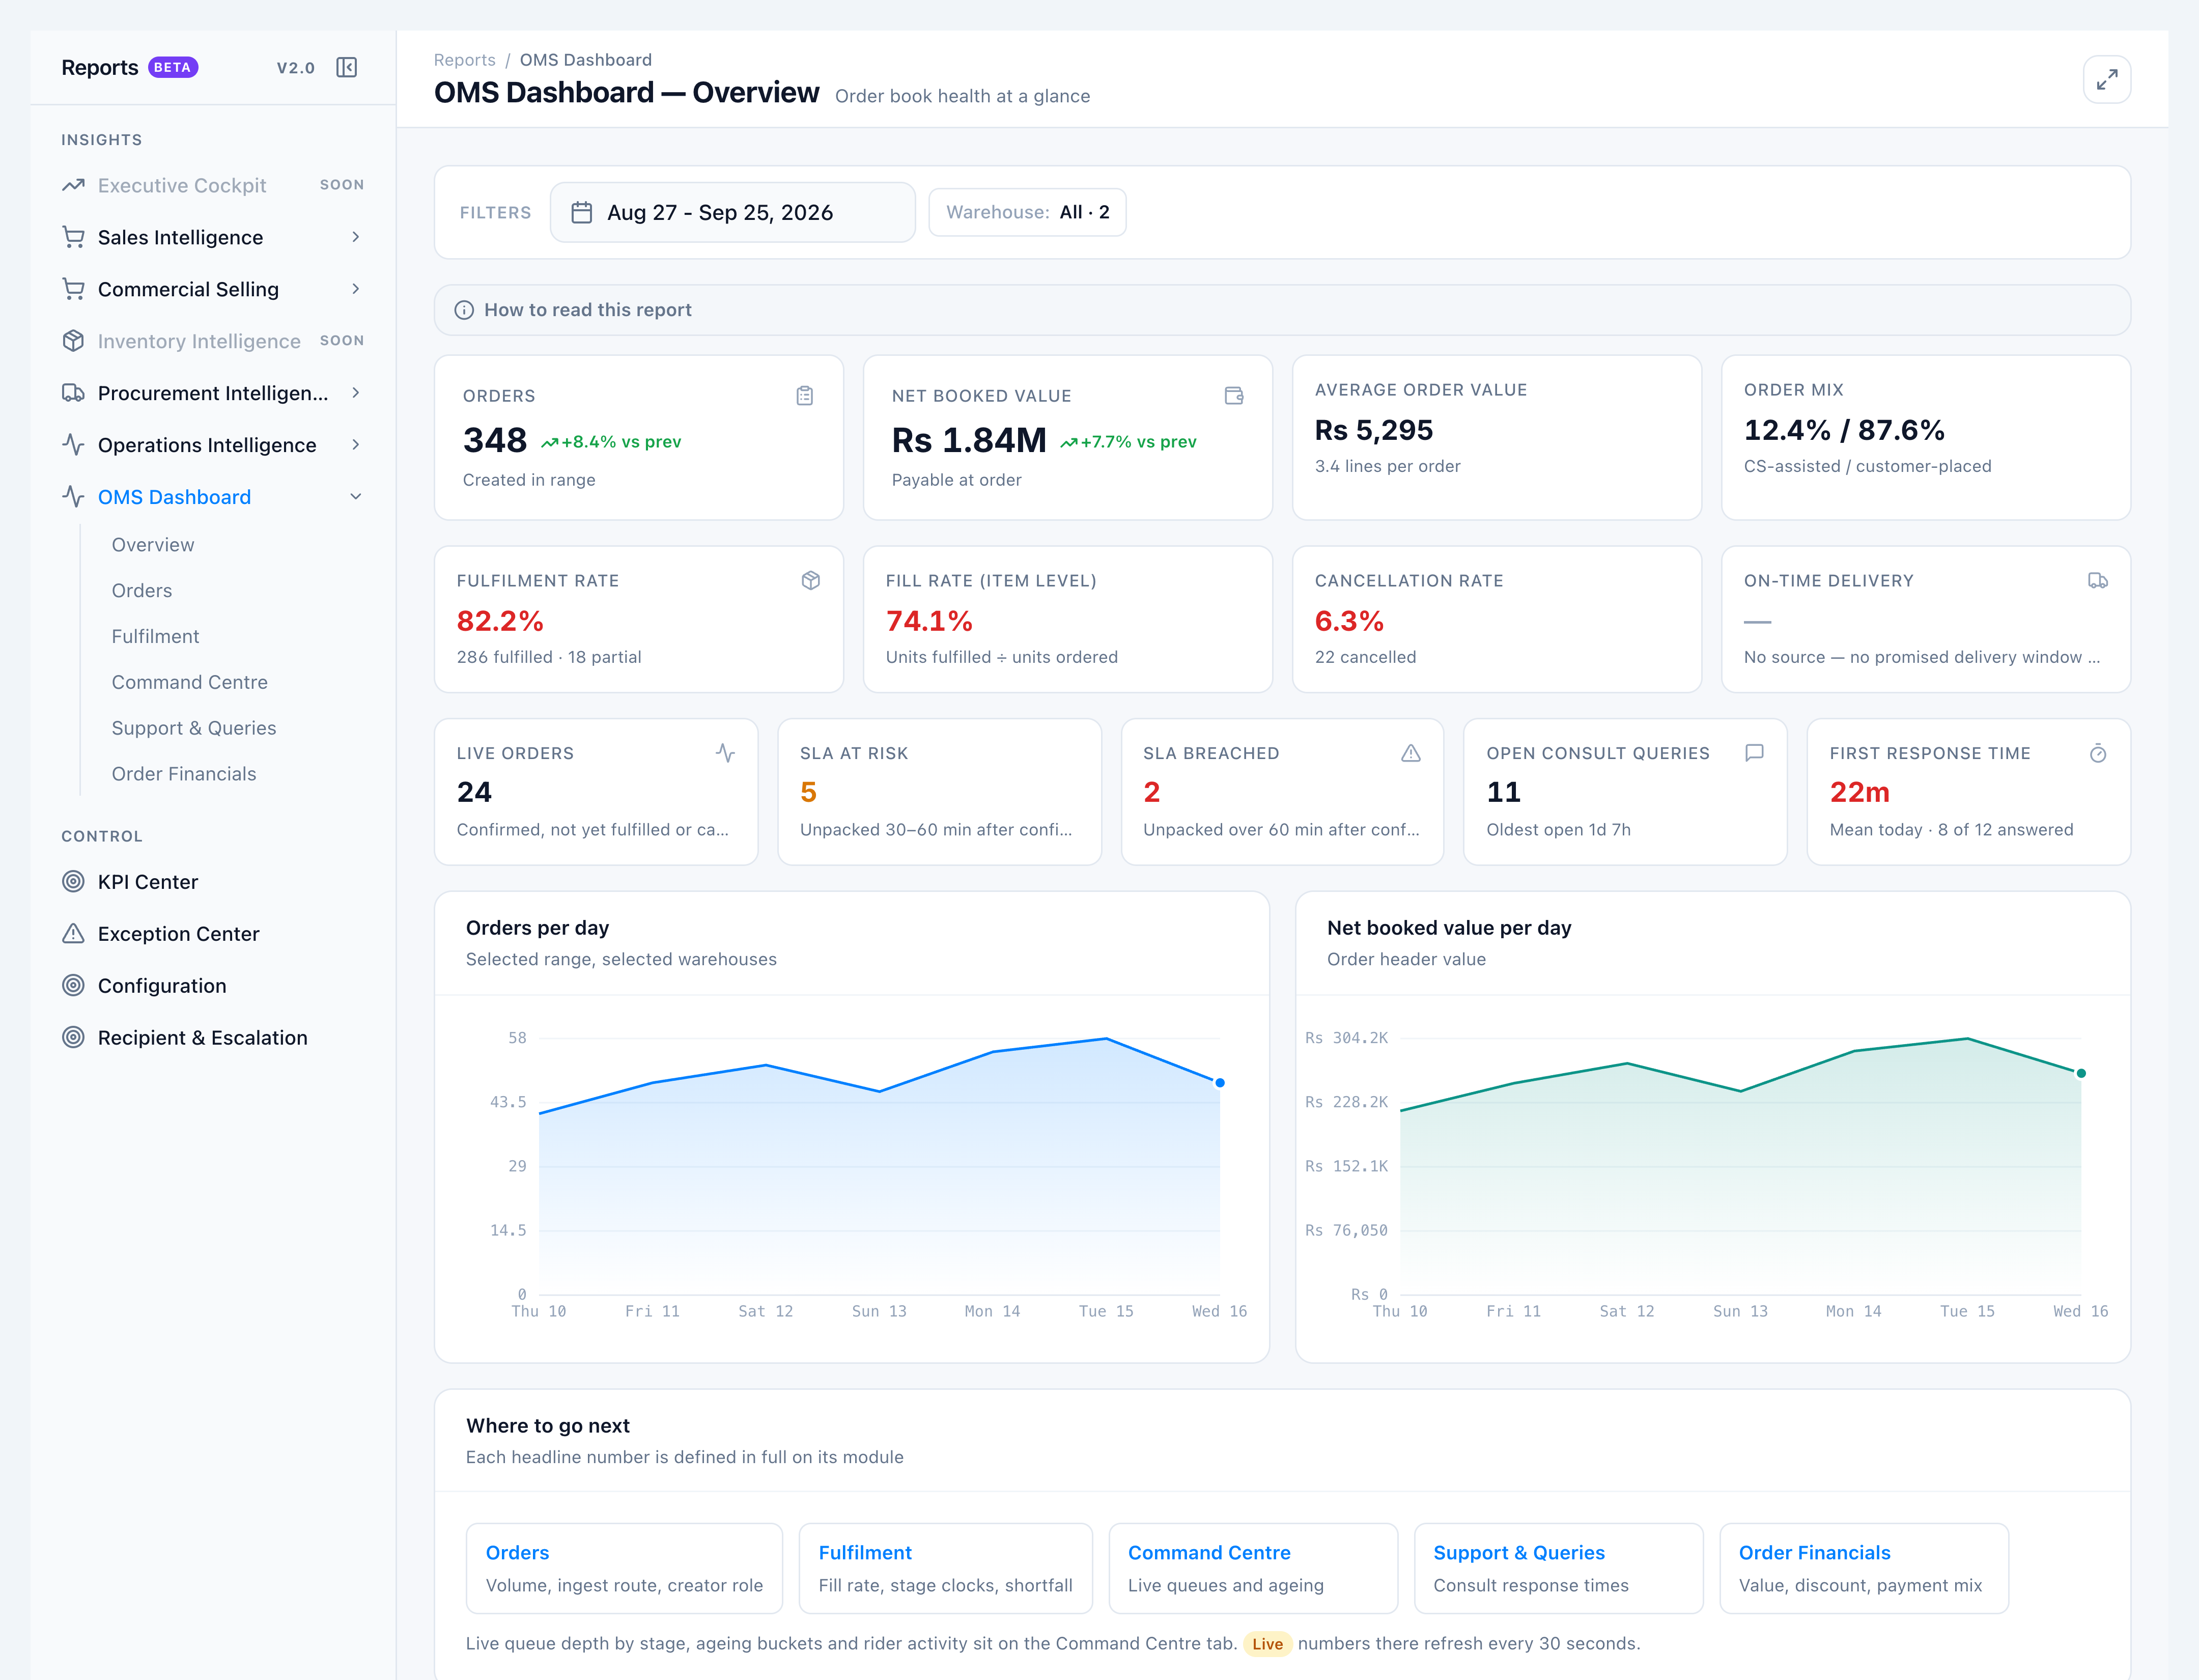
When you need a single answer to “how is the order book today?”, start on Overview. Every tile is a summary of a number defined in full on another tab.
When to use this
- Morning stand-up or evening wrap
- Checking whether volume, fill rate, or consult backlog moved after a warehouse filter change
- Confirming Order mix before you open the Orders tab
Steps
- Go to Insights → Reports v2.0 → Reports V2, then OMS Dashboard → Overview.
- Set the date range. Optional: open Warehouse and limit to one store.
- Read the range tiles: Orders, Net booked value, Average order value, Order mix.
- Read fulfilment: Fulfilment rate, Fill rate (item level), Cancellation rate. On-time delivery stays blank until orders carry a promised window.
- Read the live row: Live orders, SLA at risk, SLA breached, Open consult queries, First response time. The date filter does not apply to this row.
- Use Where to go next to open the tab that owns a number.
Success looks like
- Order mix shows two percentages and the sub-label CS-assisted / customer-placed.
- Changing warehouse changes range tiles; live tiles change only when that warehouse’s live queue changes.
- On-time delivery is blank with No source — no promised delivery window on orders.
If it goes wrong
- Permission denied / missing group — Role needs View OMS Dashboard (
order.reports.oms_dashboard). - All zeros — No OMS orders in the range, or the warehouse is not enabled under Reports v2 → Configuration.
- Order mix blank — No API or storefront orders in range (hospital, phone, WhatsApp, and manual entry are excluded from the mix).