Read Operational KPIs
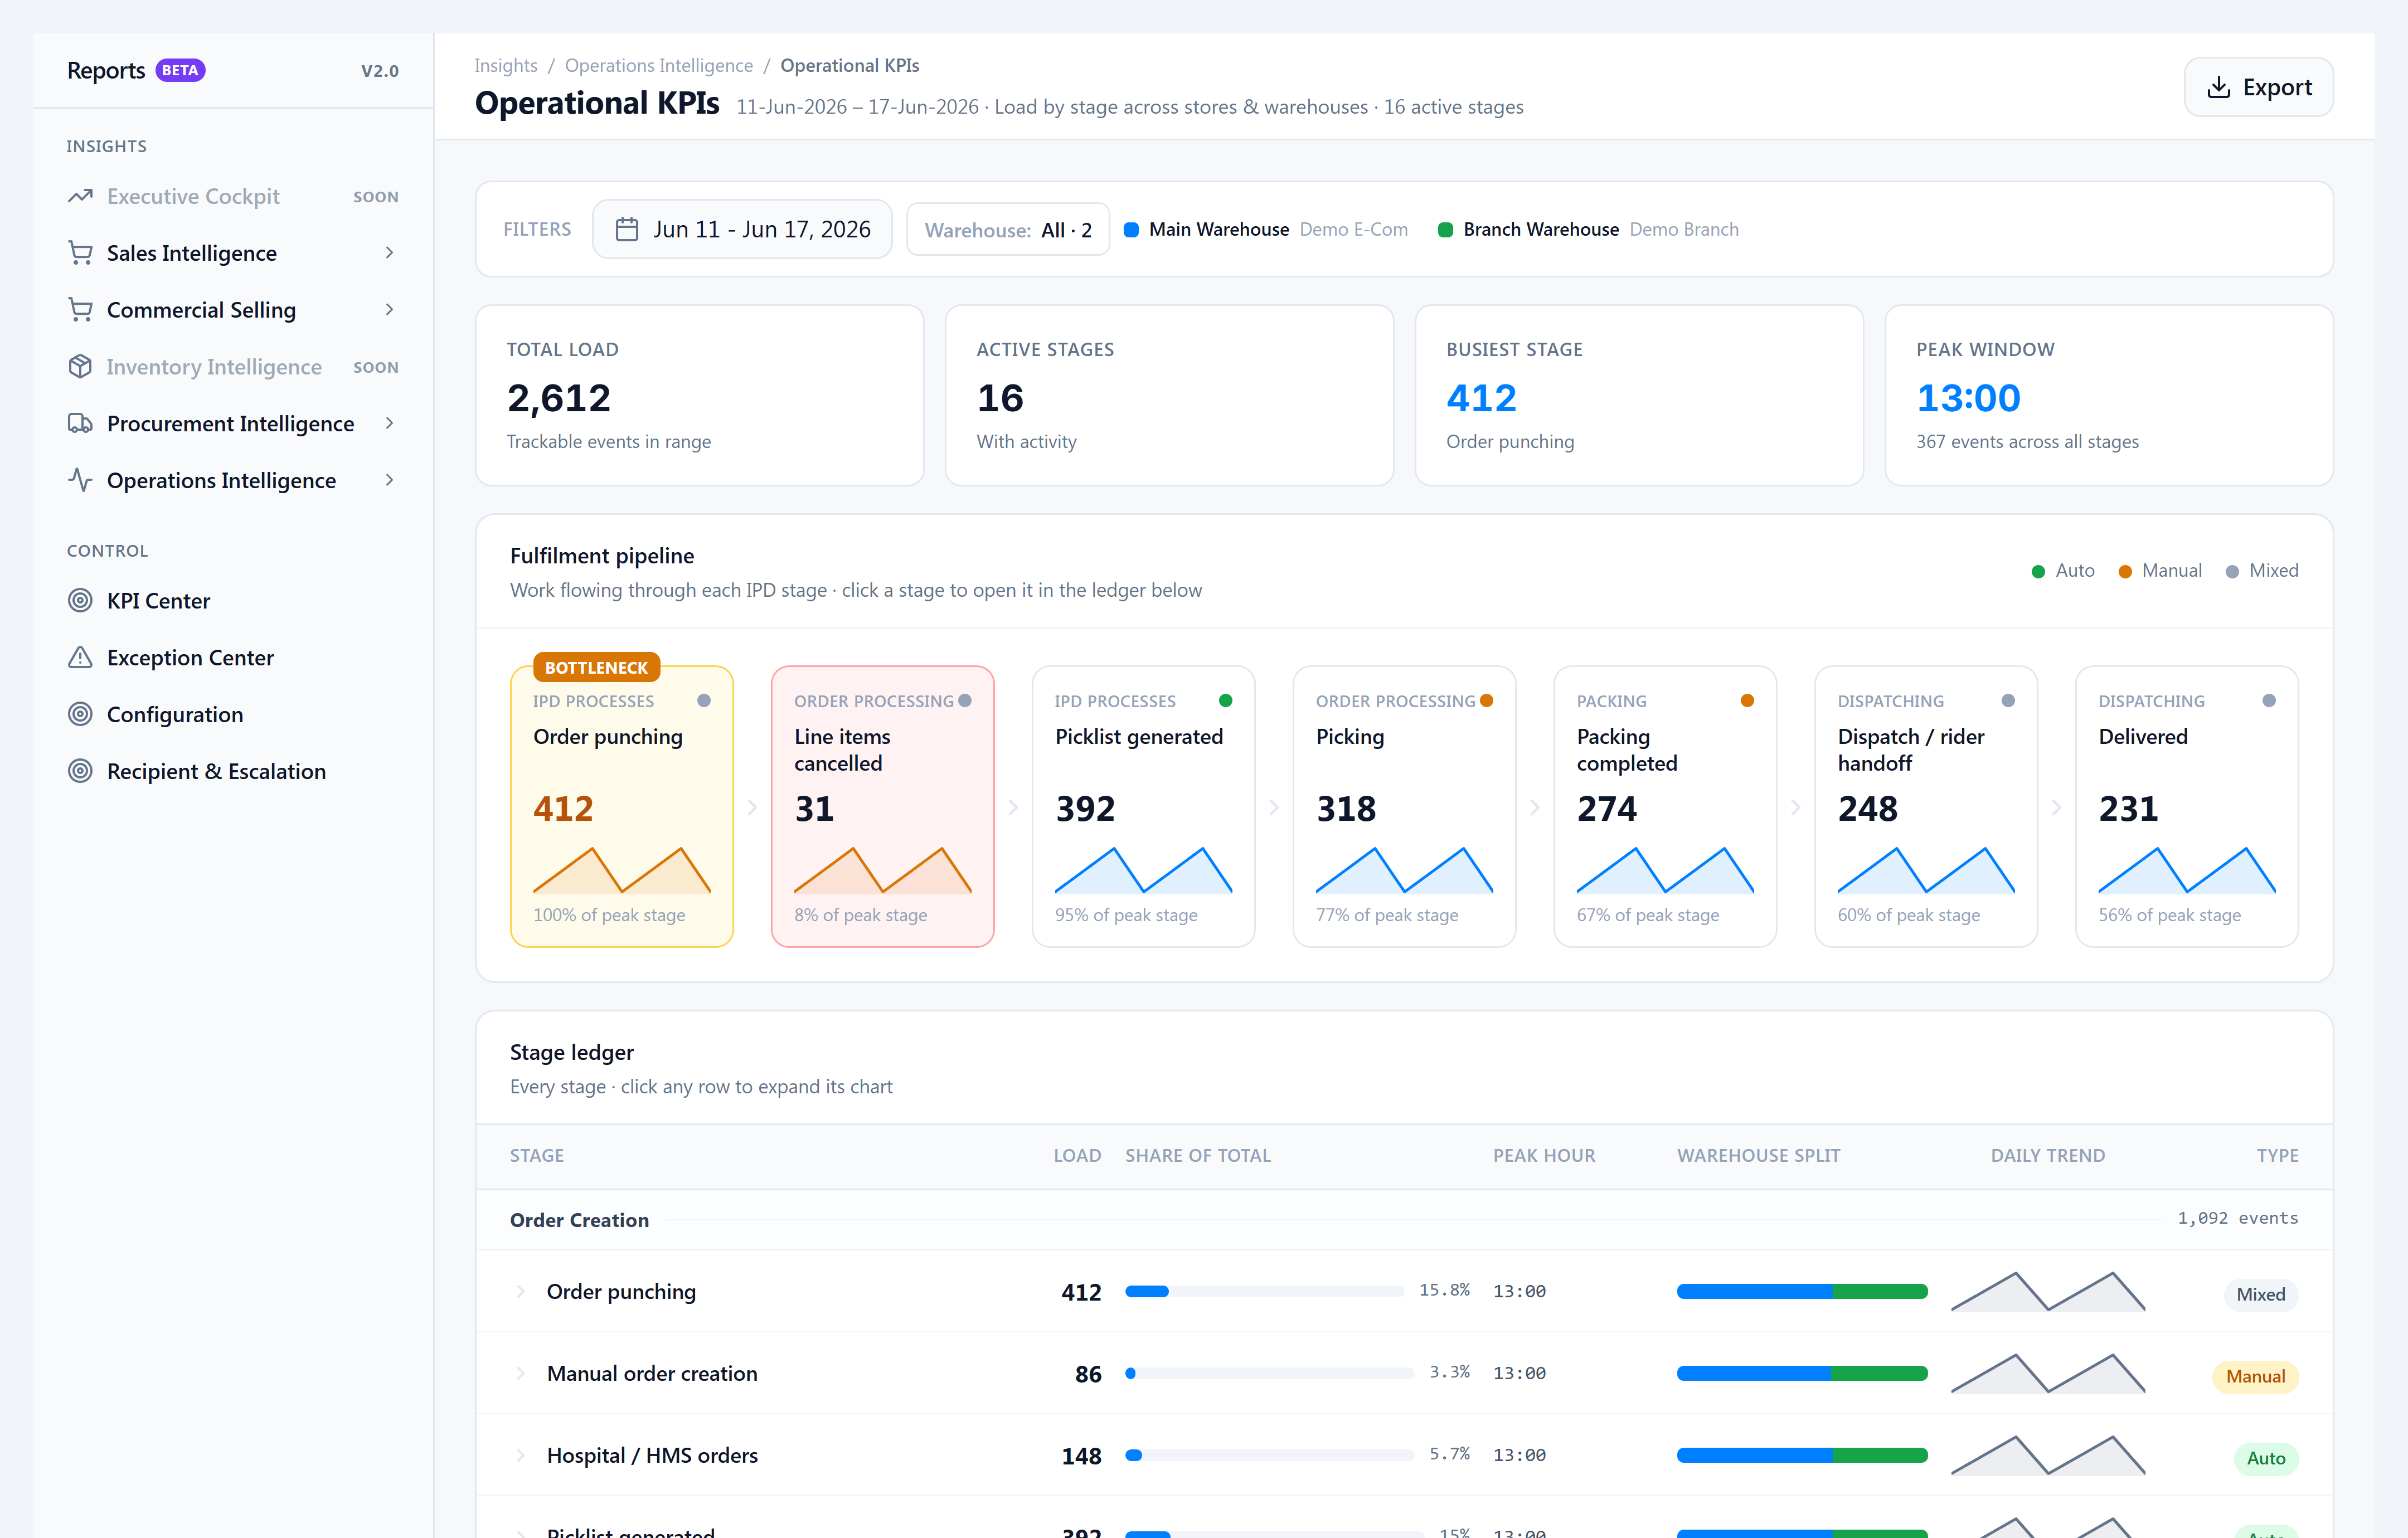
When you need to plan the next shift or explain why the packing bench was saturated, use Operational KPIs — it counts discrete work events (orders punched, lines picked, picklists dispatched, and so on) in your date range.
When to use this
- End-of-day review with the warehouse lead
- Comparing Demo Central WH vs branch load (any enabled warehouses in your tenant)
- Finding the busiest hour before scheduling extra pickers
Steps
- Go to Insights → Reports v2.0 → Reports V2, then Operations Intelligence → Operational KPIs.
- Set the date range in the filter bar (defaults to the last 7 days).
- Optional: open the Warehouses chip and limit to one or more stores/warehouses (only warehouses enabled in Reports v2 → Configuration appear).
- Read the KPI tiles at the top — total events, active stages, busiest stage, peak hour window.
- Use the Fulfilment pipeline row — click a stage card (e.g. Picking) to scroll the Stage ledger to that metric.
- Toggle Hourly or Daily on a chart row to change bucket size.
- Hover chart segments or pipeline cards for how load is counted (especially Pending lines and Picking).
- To export: click Download → Excel workbook with filters and matrix data.
- Open the Heatmap tab on the stage ledger — hour × stage grid with Load, Crew, or Load·op views; click a cell for hour detail; use Export for heatmap Excel/PDF.
Success looks like
- Pipeline cards show non-zero counts for stages your team ran in the range.
- Expanding a metric shows warehouse-coloured hourly or daily bars.
- Not tracked badges appear only on manual/HMS metrics not yet wired to audit (expected).
If it goes wrong
- All zeros on Picking — Confirm picklists have lines with picked_at set (fixed in OMS 1.4; if still zero, no picking happened in range).
- Empty warehouse list — Enable warehouses under Reports v2 → Configuration.
- Permission denied — Role needs View Operational KPIs Report (
order.reports.operational_kpis).