Campaign reports — reference
The home of record for what each campaign report shows. The how-to (View campaign reports) covers how to open and filter them. All three live under Reports → Commercial and offer a date range, an optional warehouse filter, and Excel export.
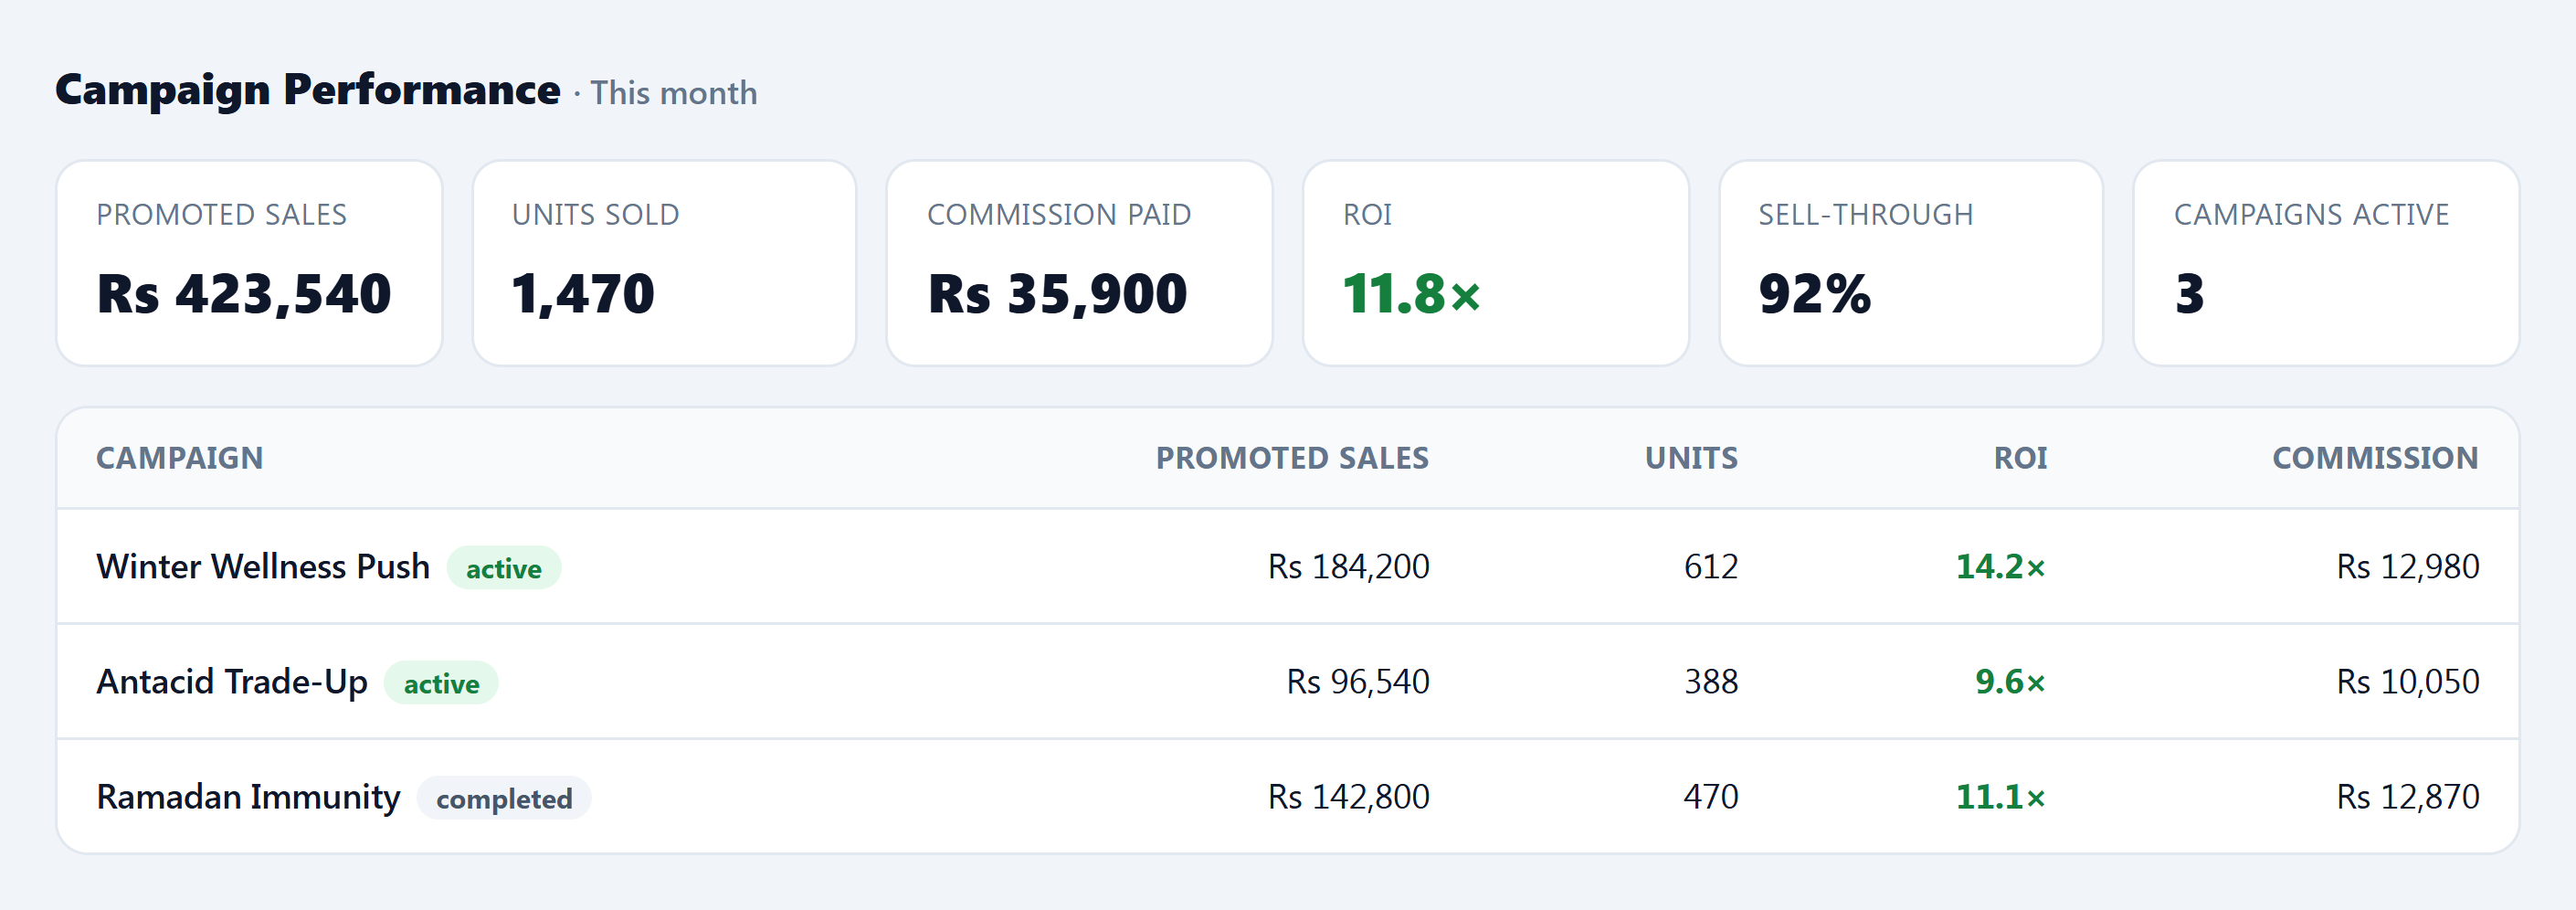
Campaign Performance — the money view
- KPIs: Total Promoted Sales · Units Sold · Commission Paid · ROI (sales ÷ commission) · Sell-through % · Campaigns Active.
- Per-campaign rows (expandable): promoted sales, incremental revenue, sell-through, ROI, margin %, units, commission, transaction count → per-SKU breakdown (units, revenue, gross margin, commission).
- Plus a daily revenue trend and a revenue-by-product table.
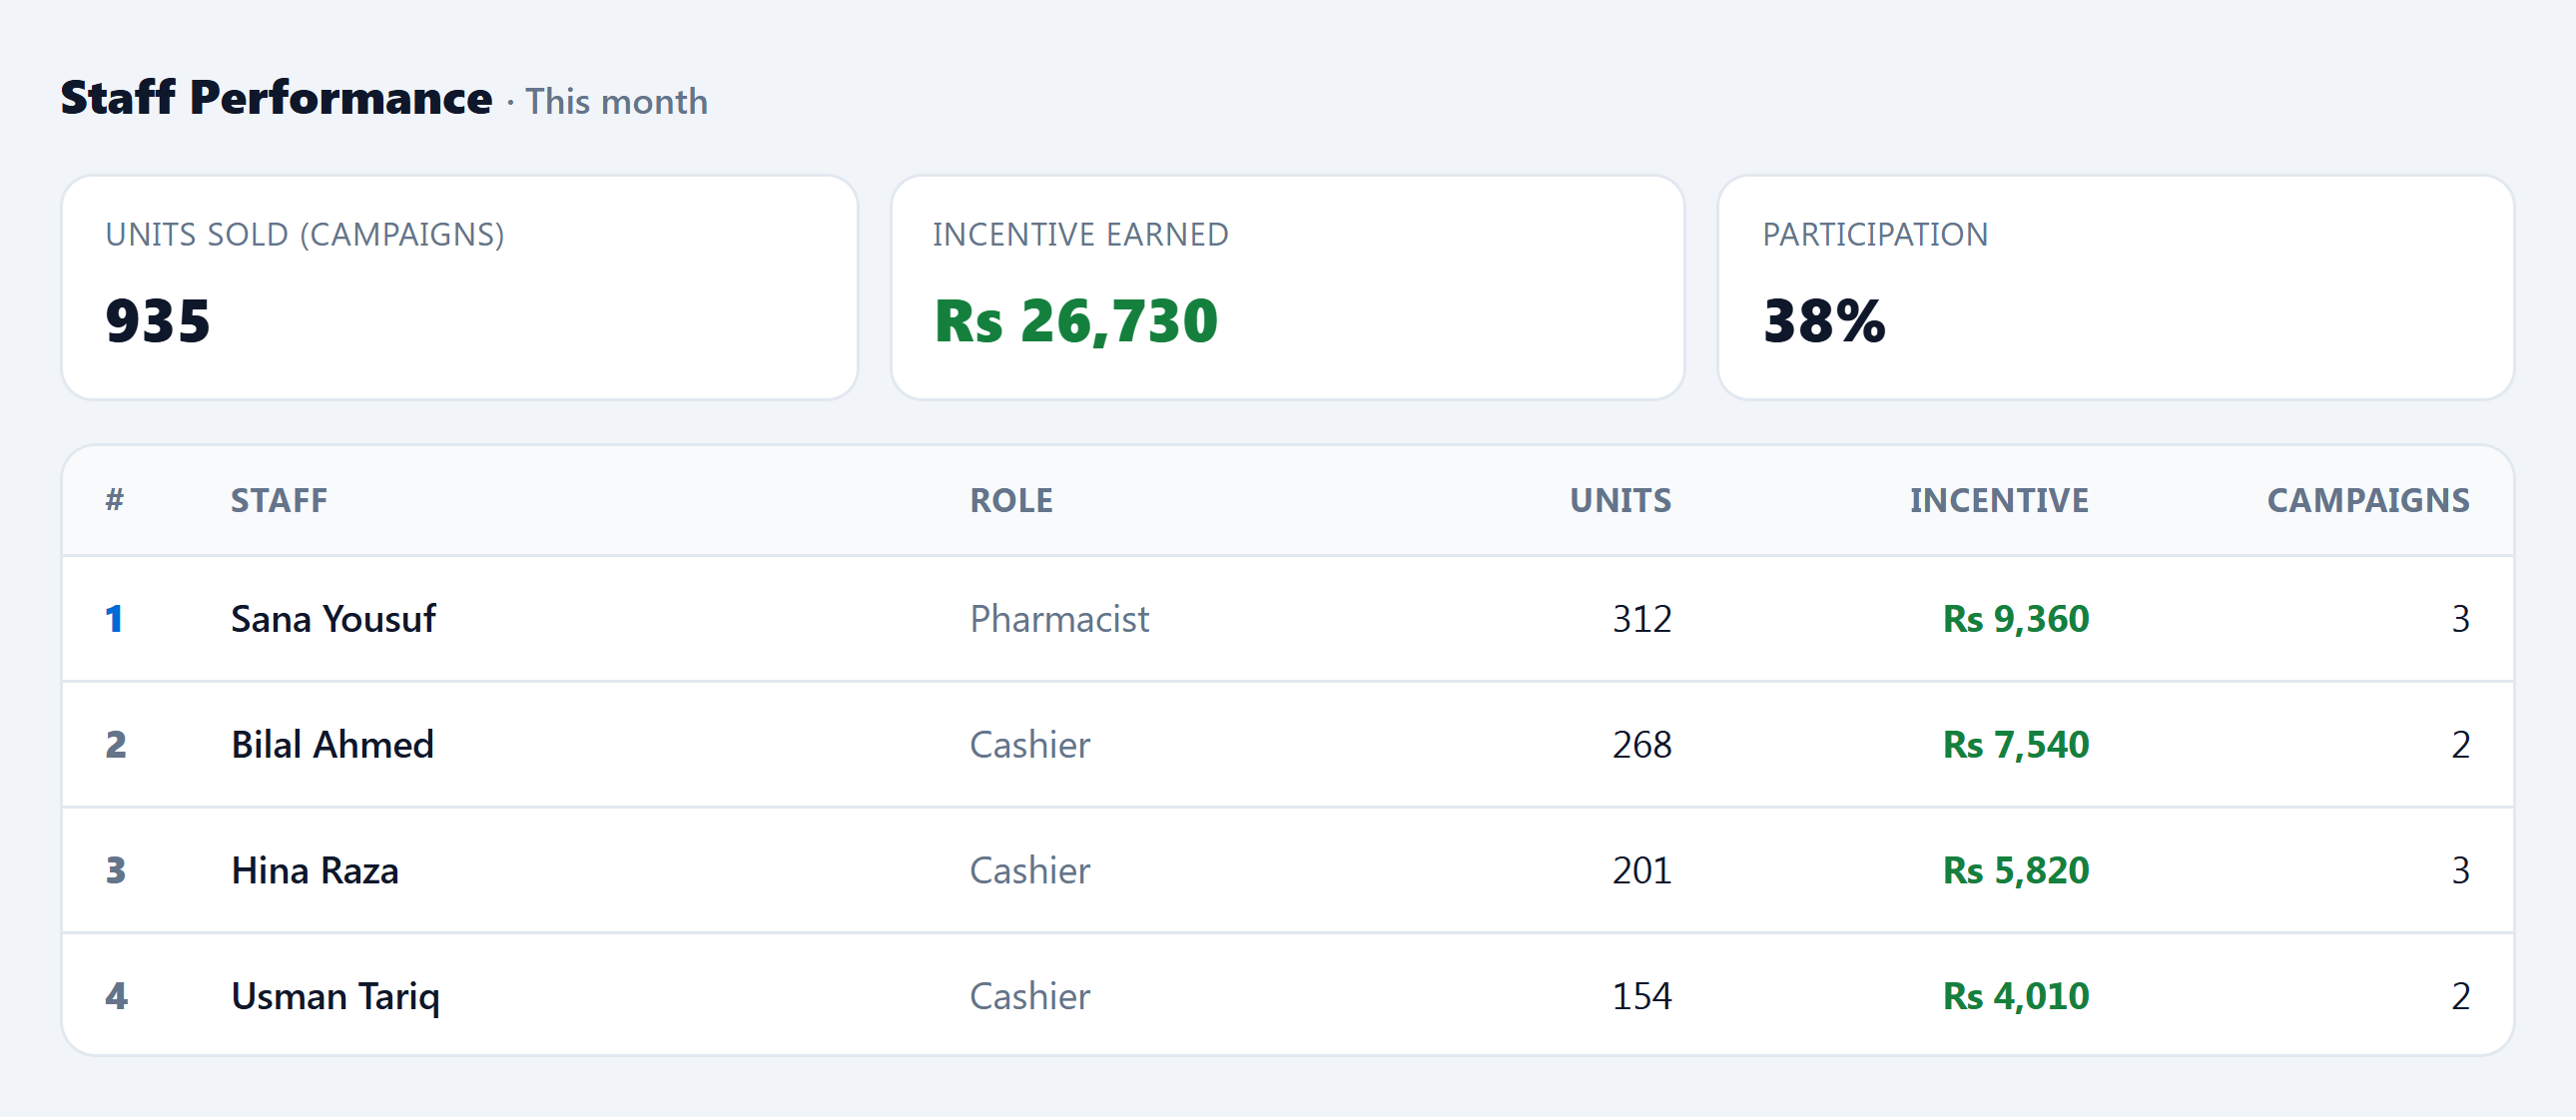
Staff Performance — the leaderboard
- KPIs: Units sold · Incentive earned · Participation % (campaign units ÷ total units).
- Leaderboard (ranked by units): staff name, role, units, incentive earned, transaction count, campaigns touched → expand for that person’s per-SKU detail.
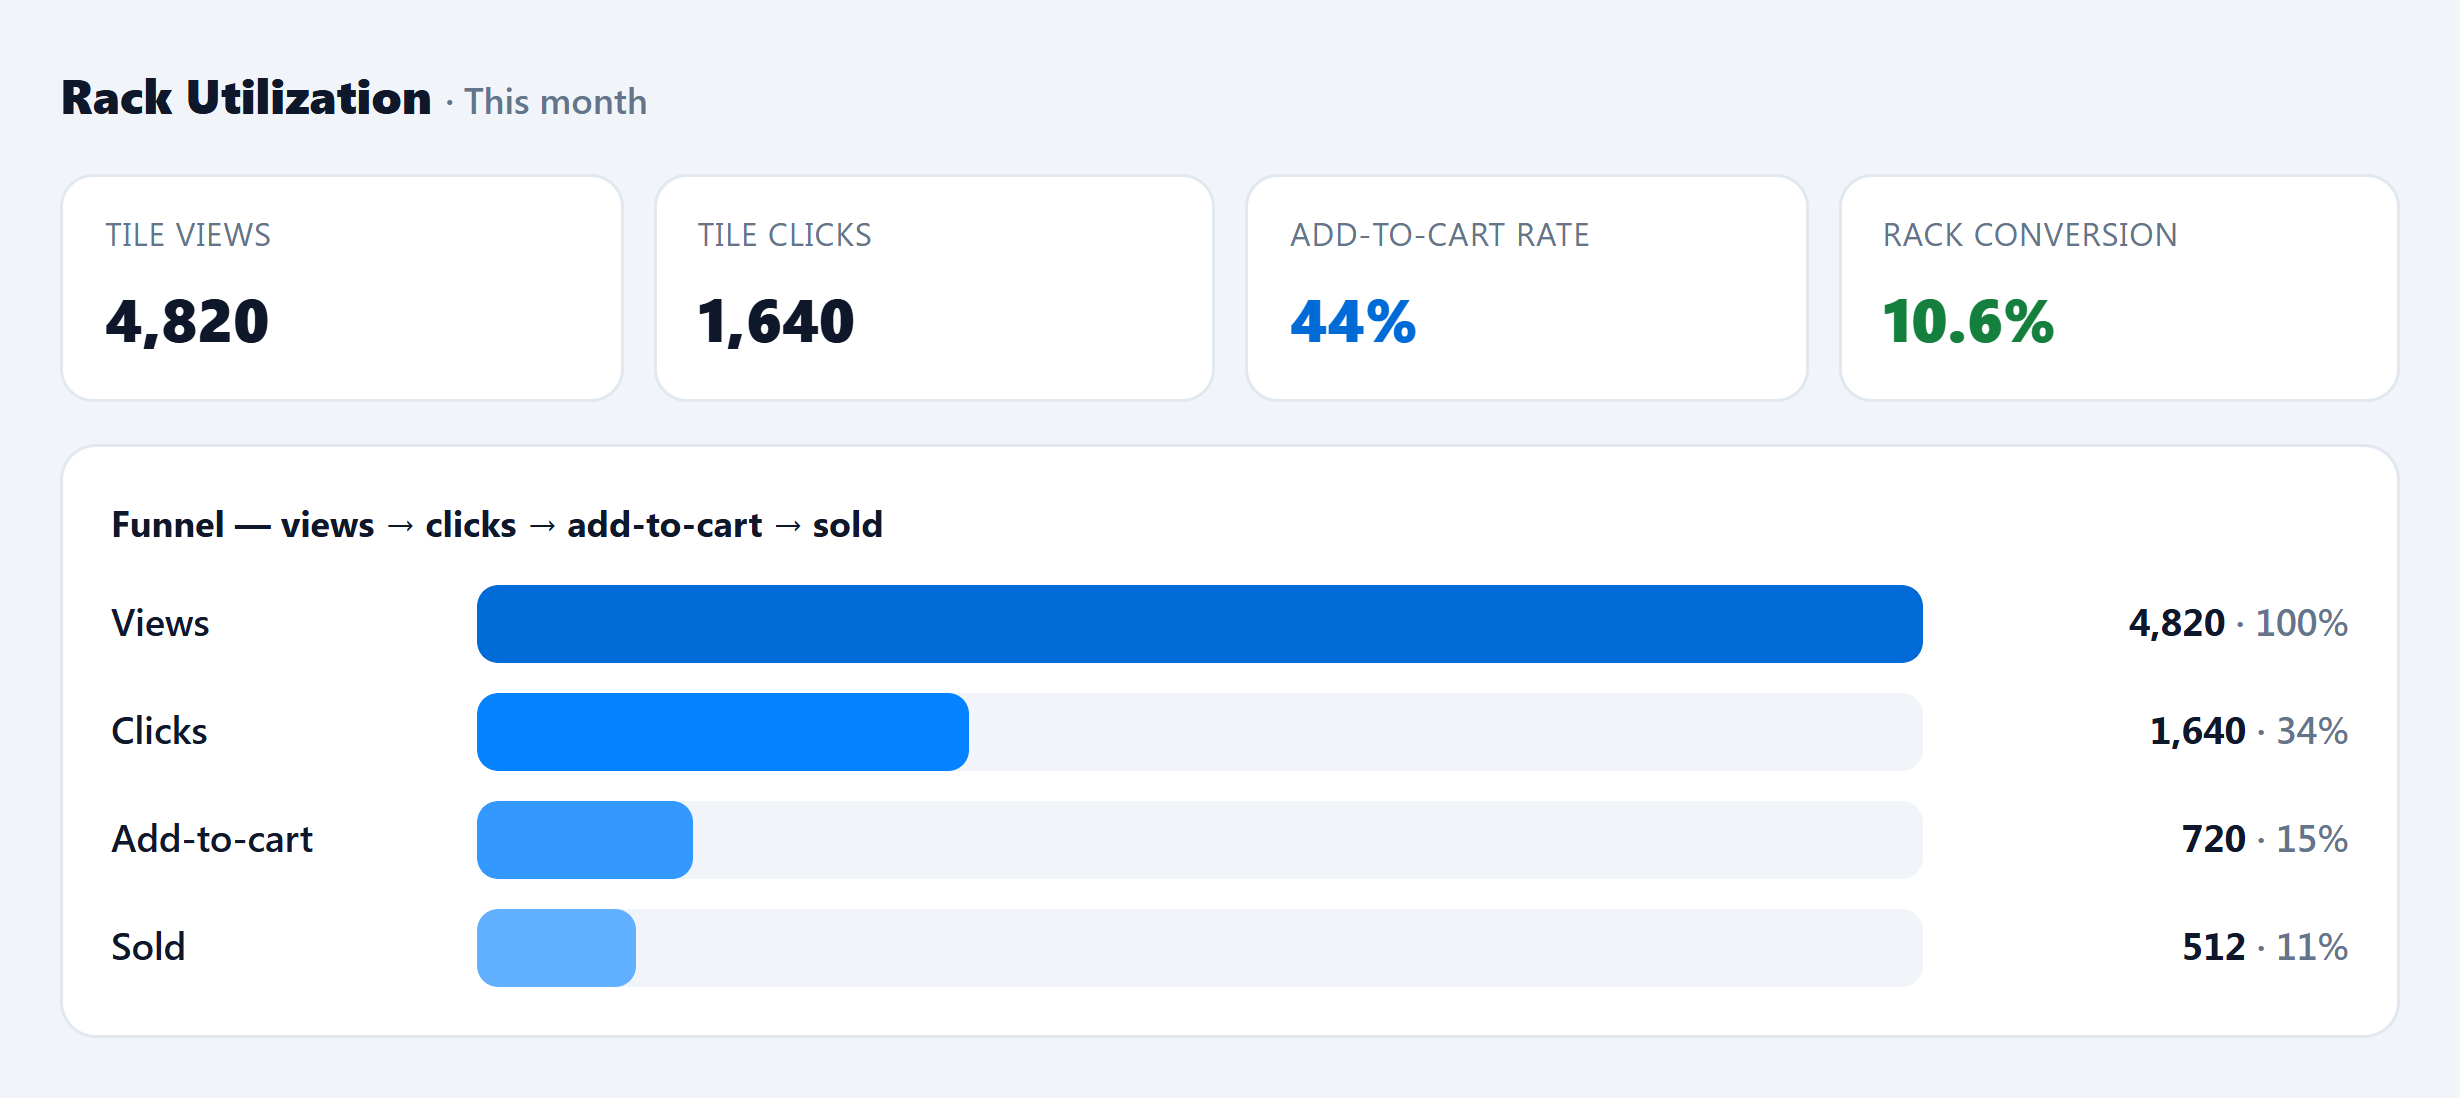
Rack Utilization — the engagement funnel
- Funnel: Views → Clicks → Add-to-cart → Sold.
- KPIs: Tile views · Tile clicks · Add-to-cart count · Units sold · Add-to-cart rate % · Rack conversion %.
- Plus top SKUs by clicks, under-performing SKUs, and a daily clicks trend.