Tutorial: Read your first OMS Dashboard
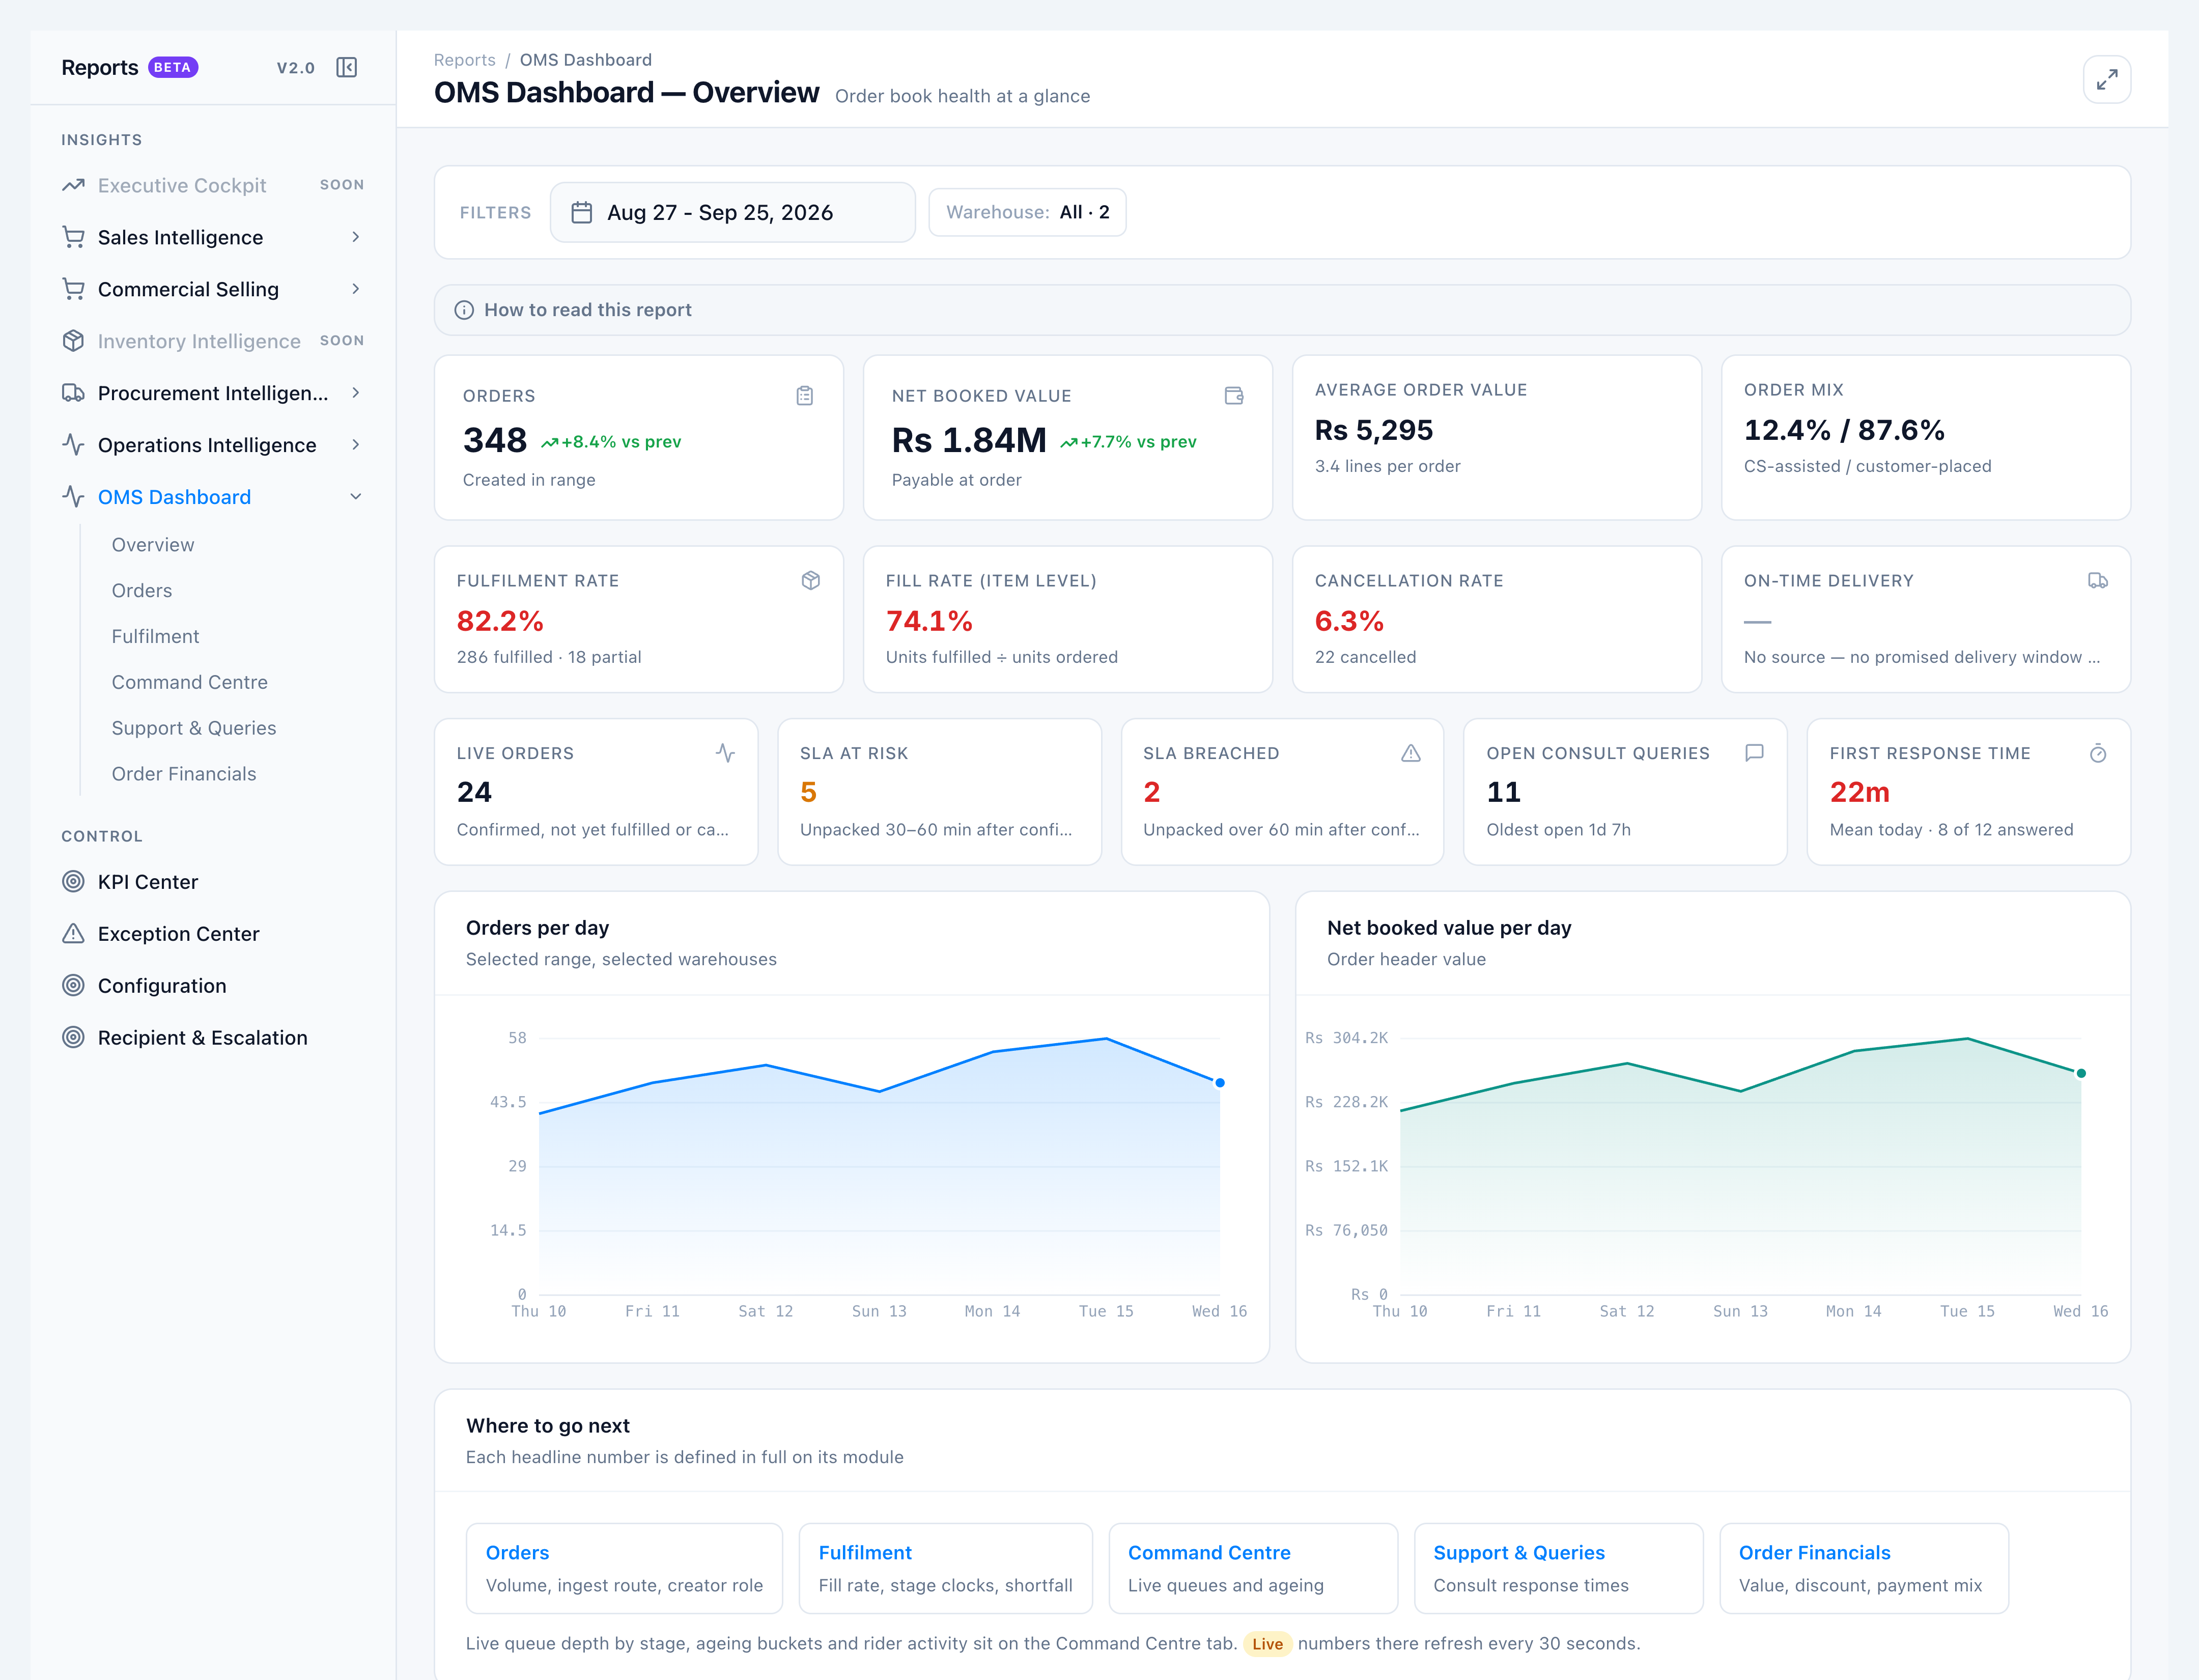
This tutorial is one continuous pass. Use the same date range and warehouse on every tab. The screenshots use fixture demo data (348 orders, Rs 1.84m booked) so you can see what a populated month looks like.
1. Open Overview and set the filter
Go to Insights → Reports v2.0 → Reports V2, then OMS Dashboard → Overview.
Set the date range (the filter defaults to the last 30 days). Optional: open the Warehouse chip and pick one store. The same filter follows you onto Operational KPIs.
Read the first row: Orders, Net booked value, Average order value, and Order mix (CS-assisted % / customer-placed %).
2. Confirm volume on Orders
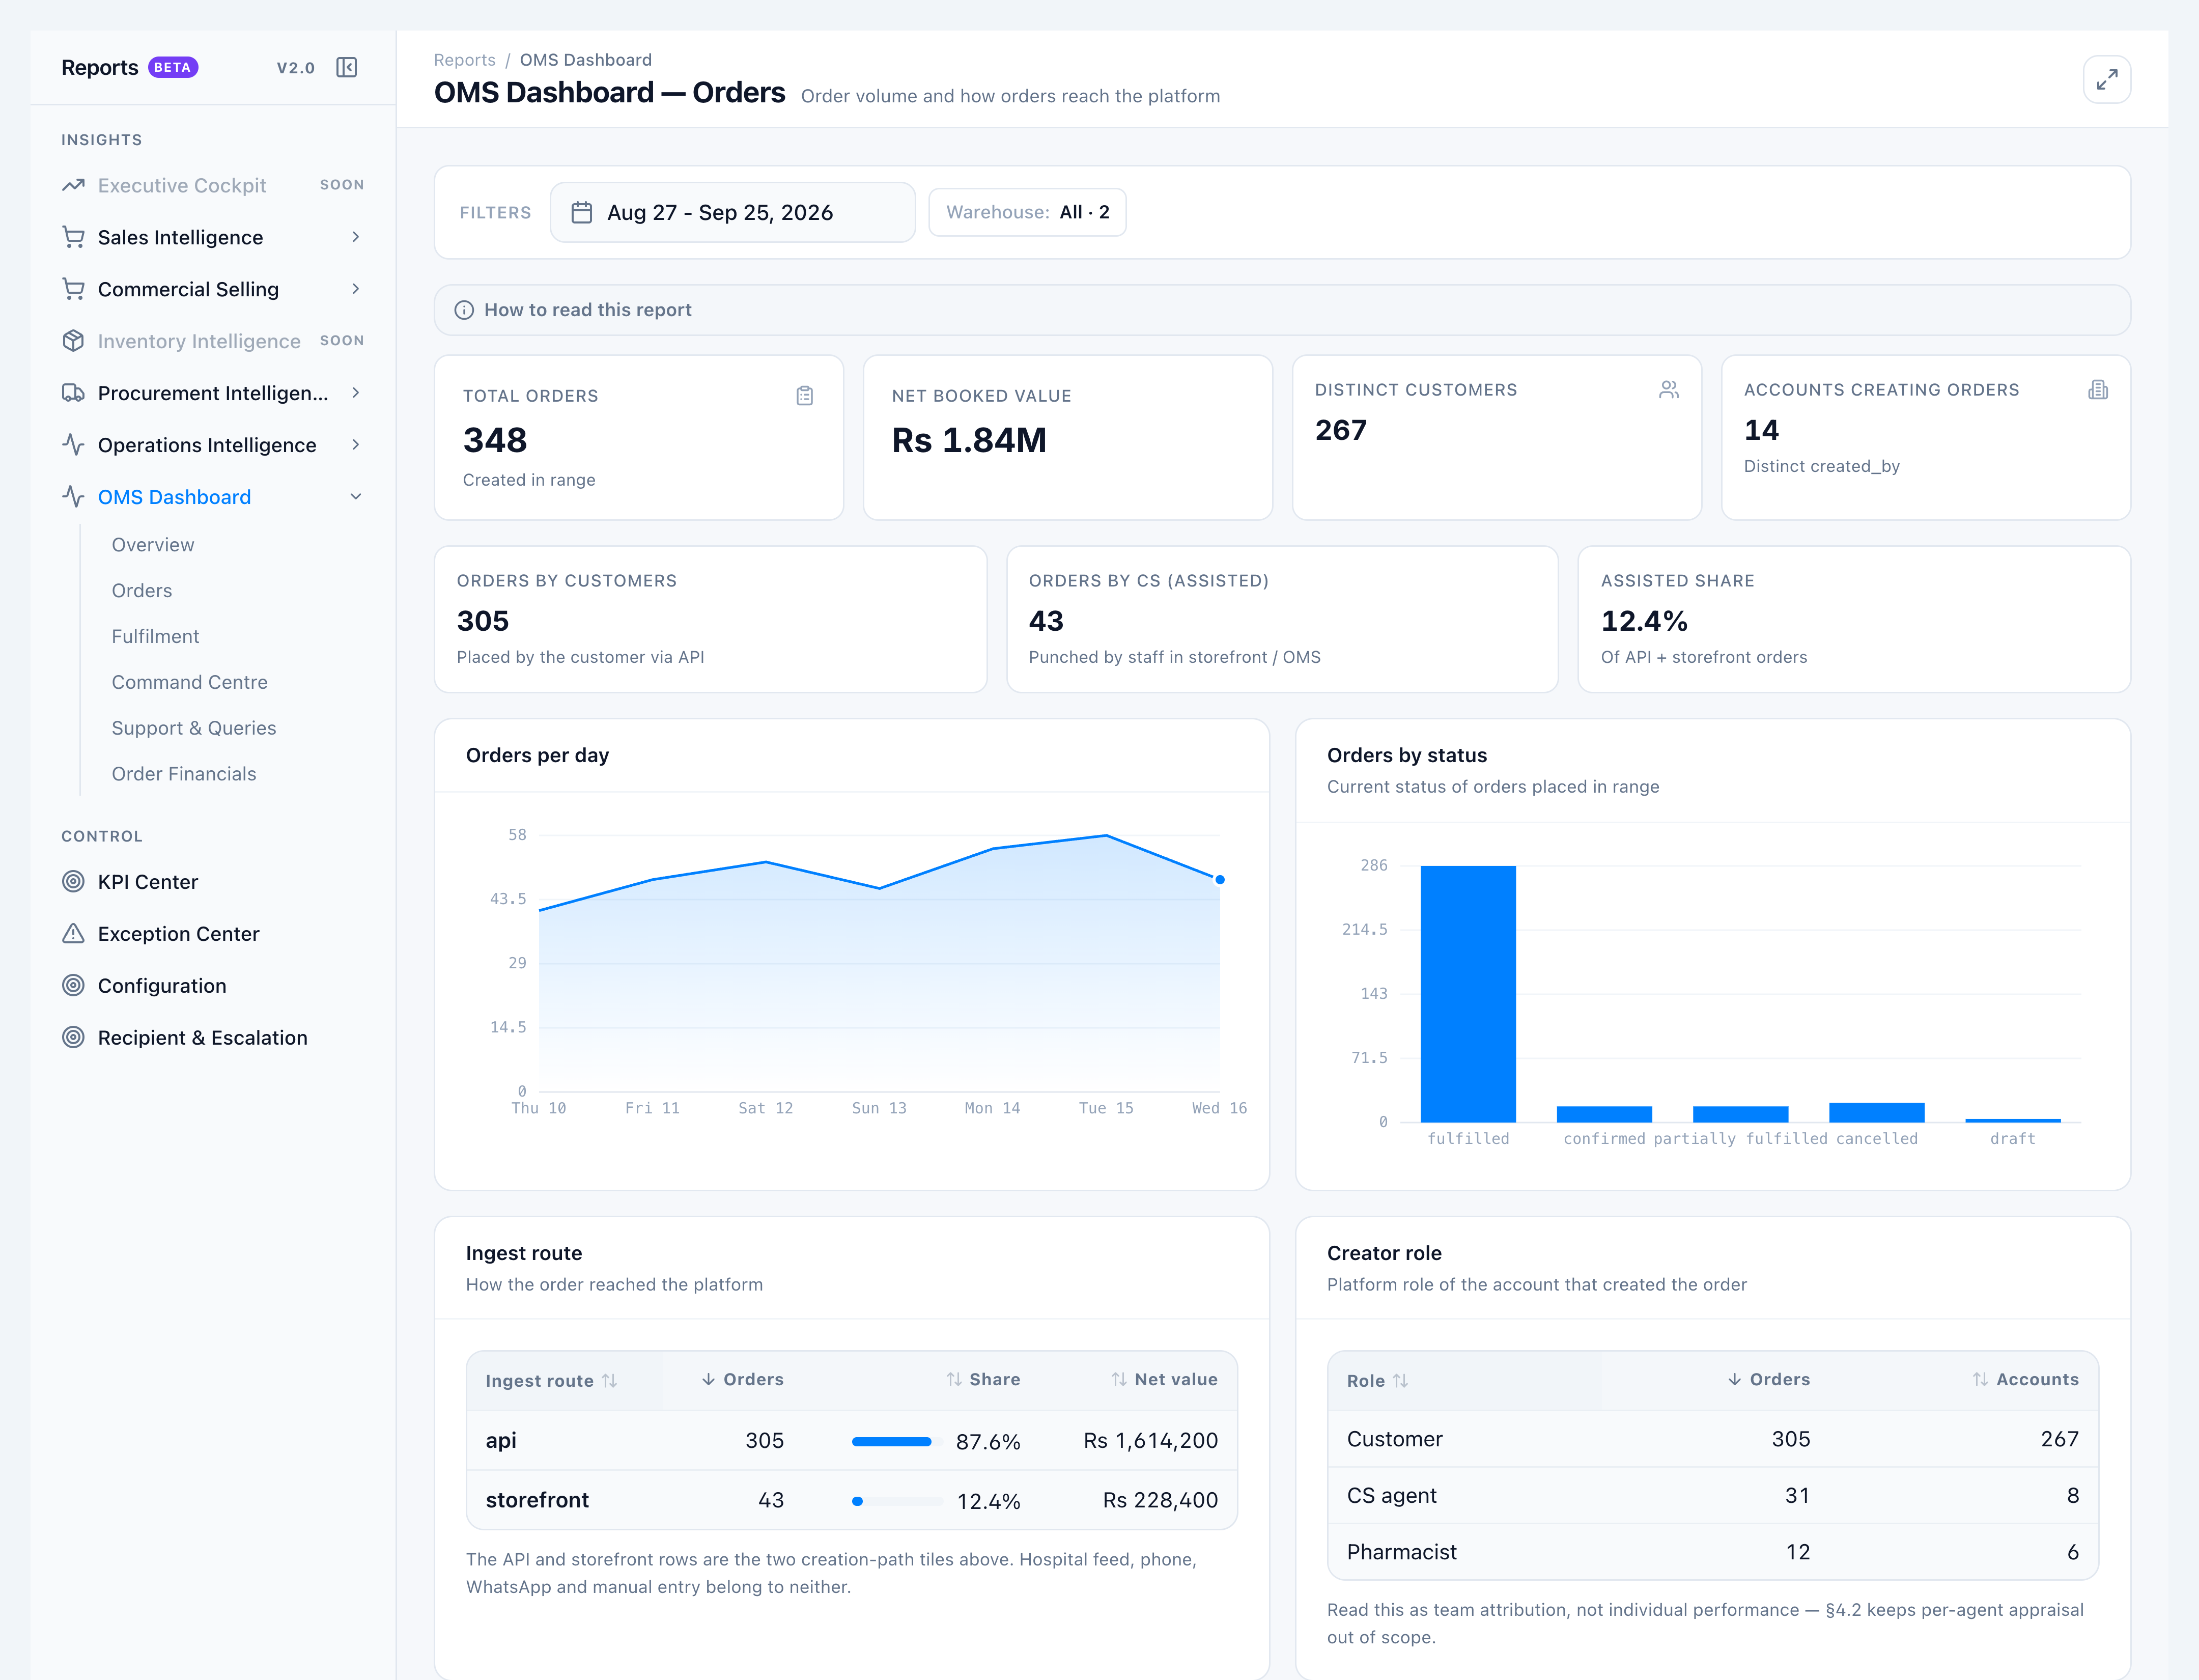
Open Orders. Total orders and Net booked value must match Overview.
Check Orders by customers (API) plus Orders by CS (assisted) (storefront). Assisted share is the first percentage on Overview Order mix.
3. Check fulfilment quality
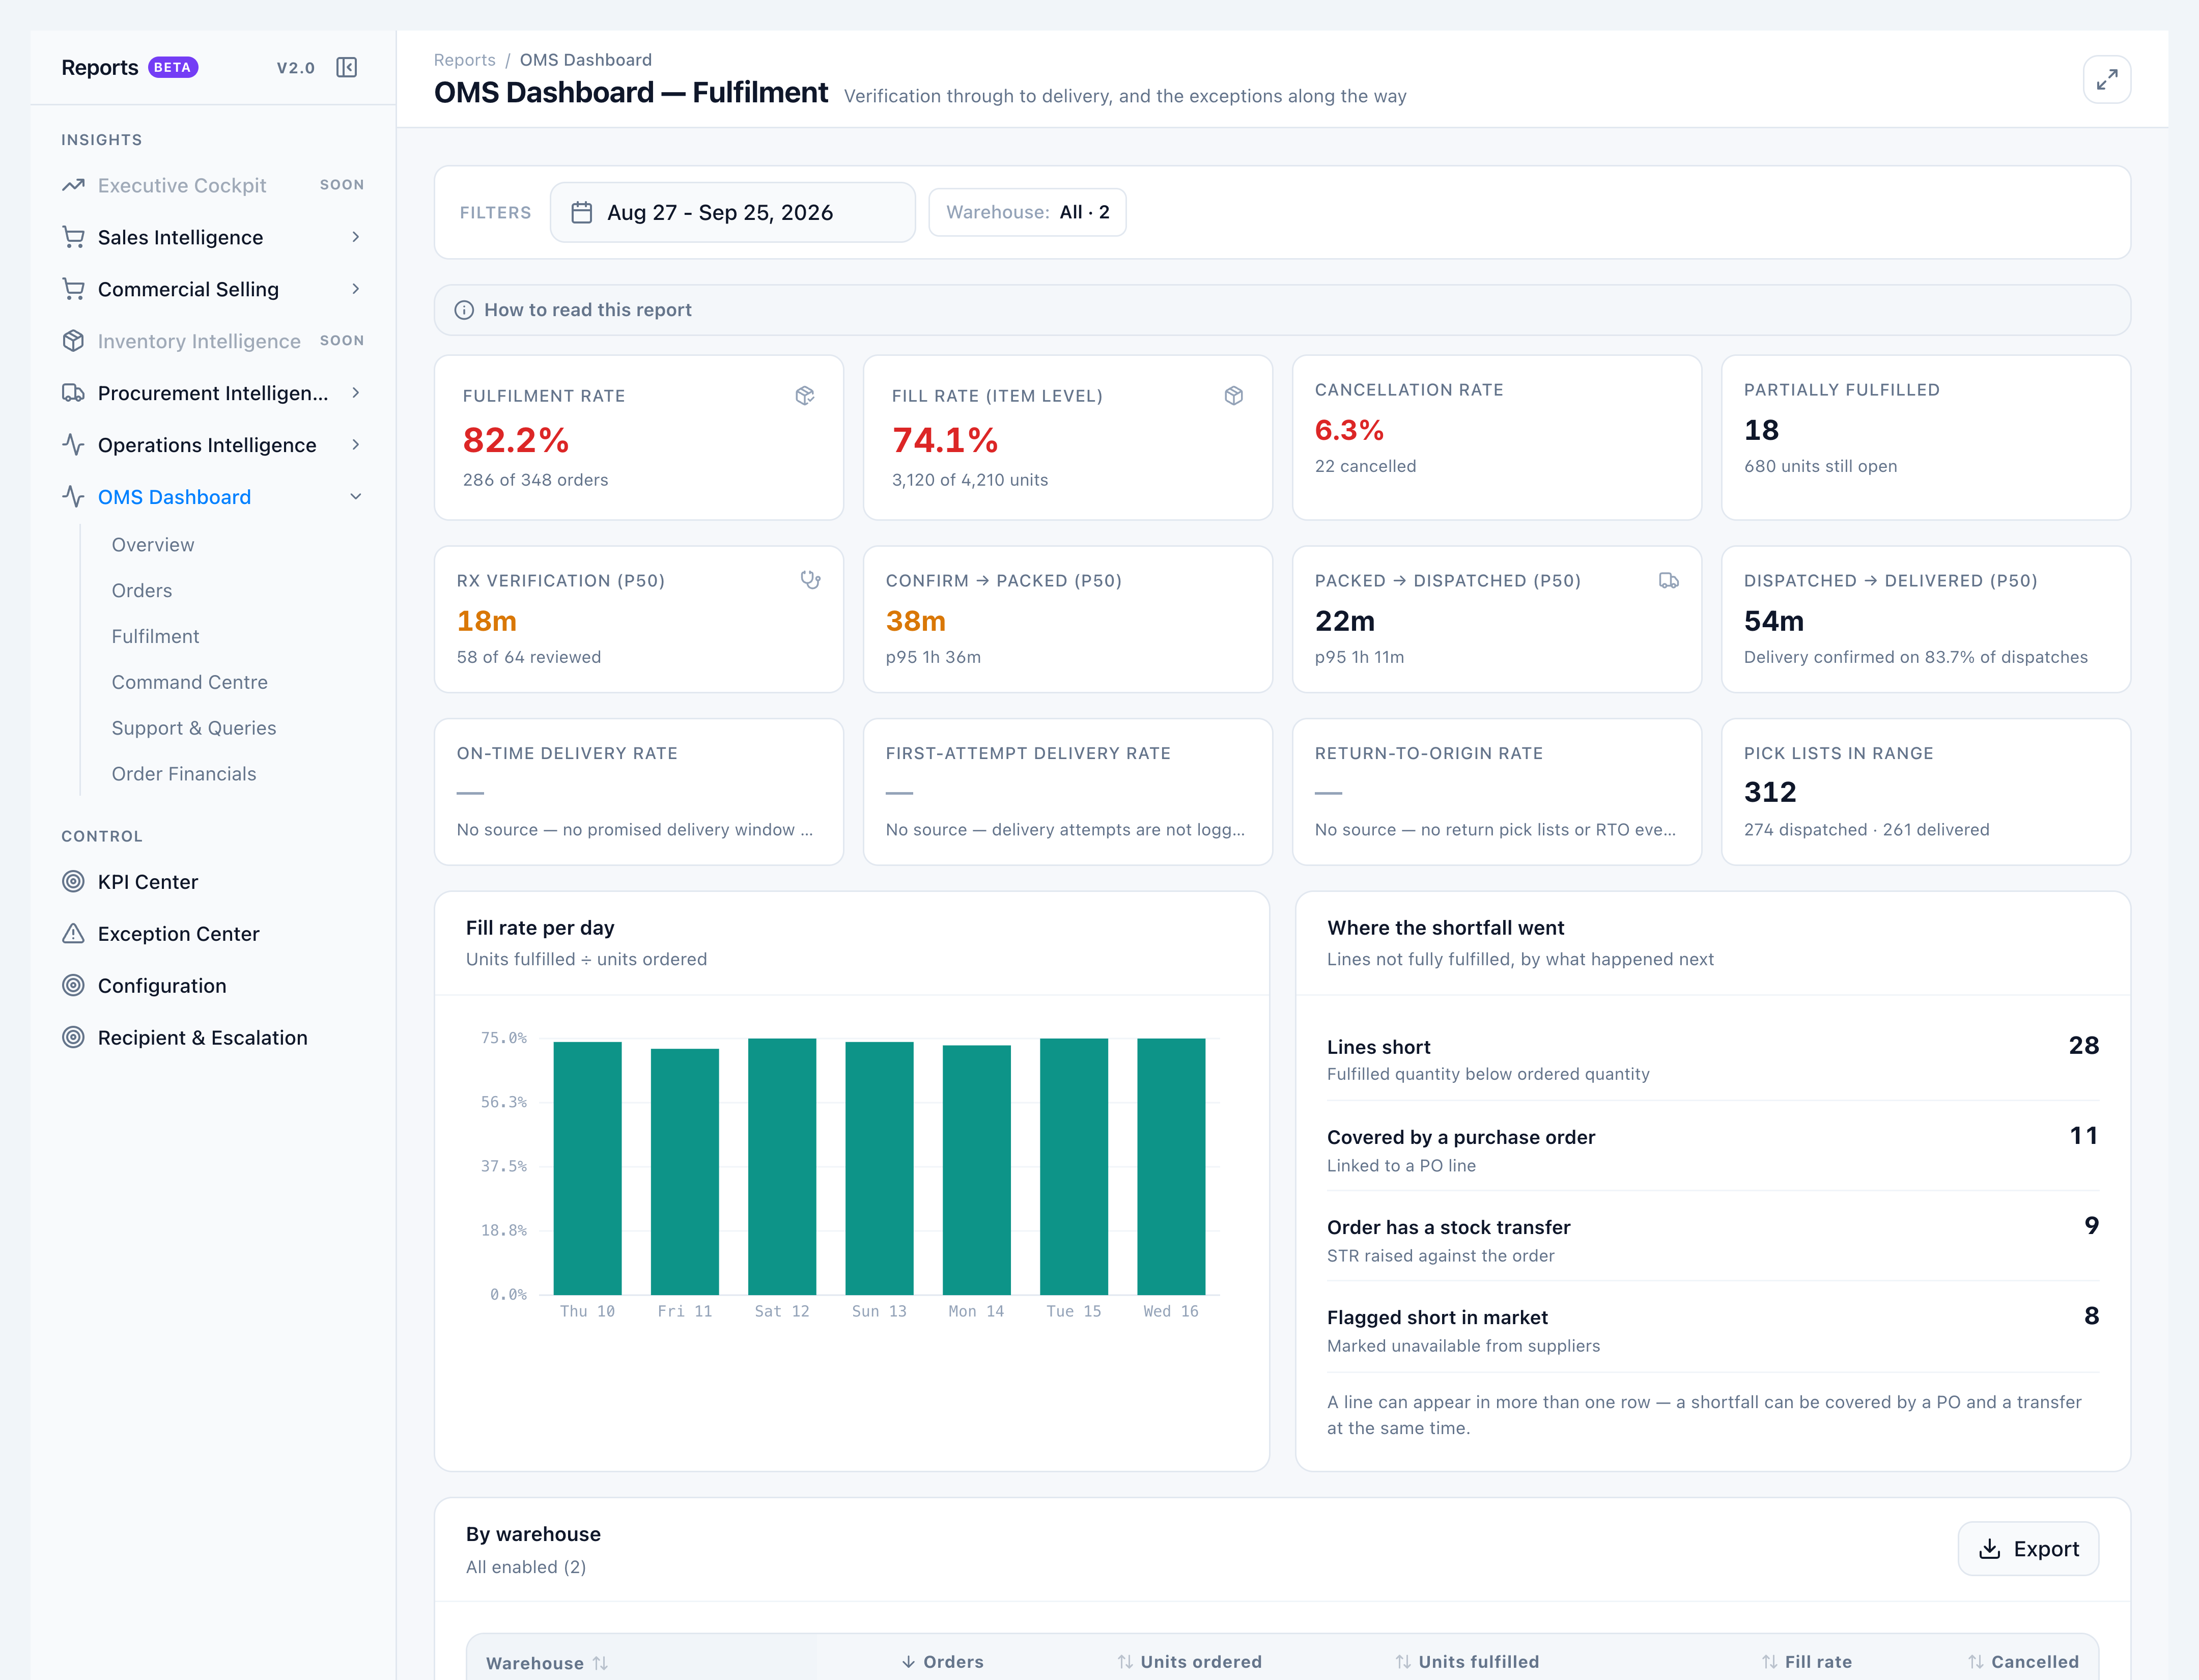
Open Fulfilment. Fulfilment rate, Fill rate (item level), and Cancellation rate must match Overview.
Fill rate keeps cancelled units in the denominator — a cancelled line is unfilled, not ignored.
Tiles with No source — … stay blank (on-time delivery, first-attempt, return-to-origin). That is expected.
4. Look at live work on Command Centre
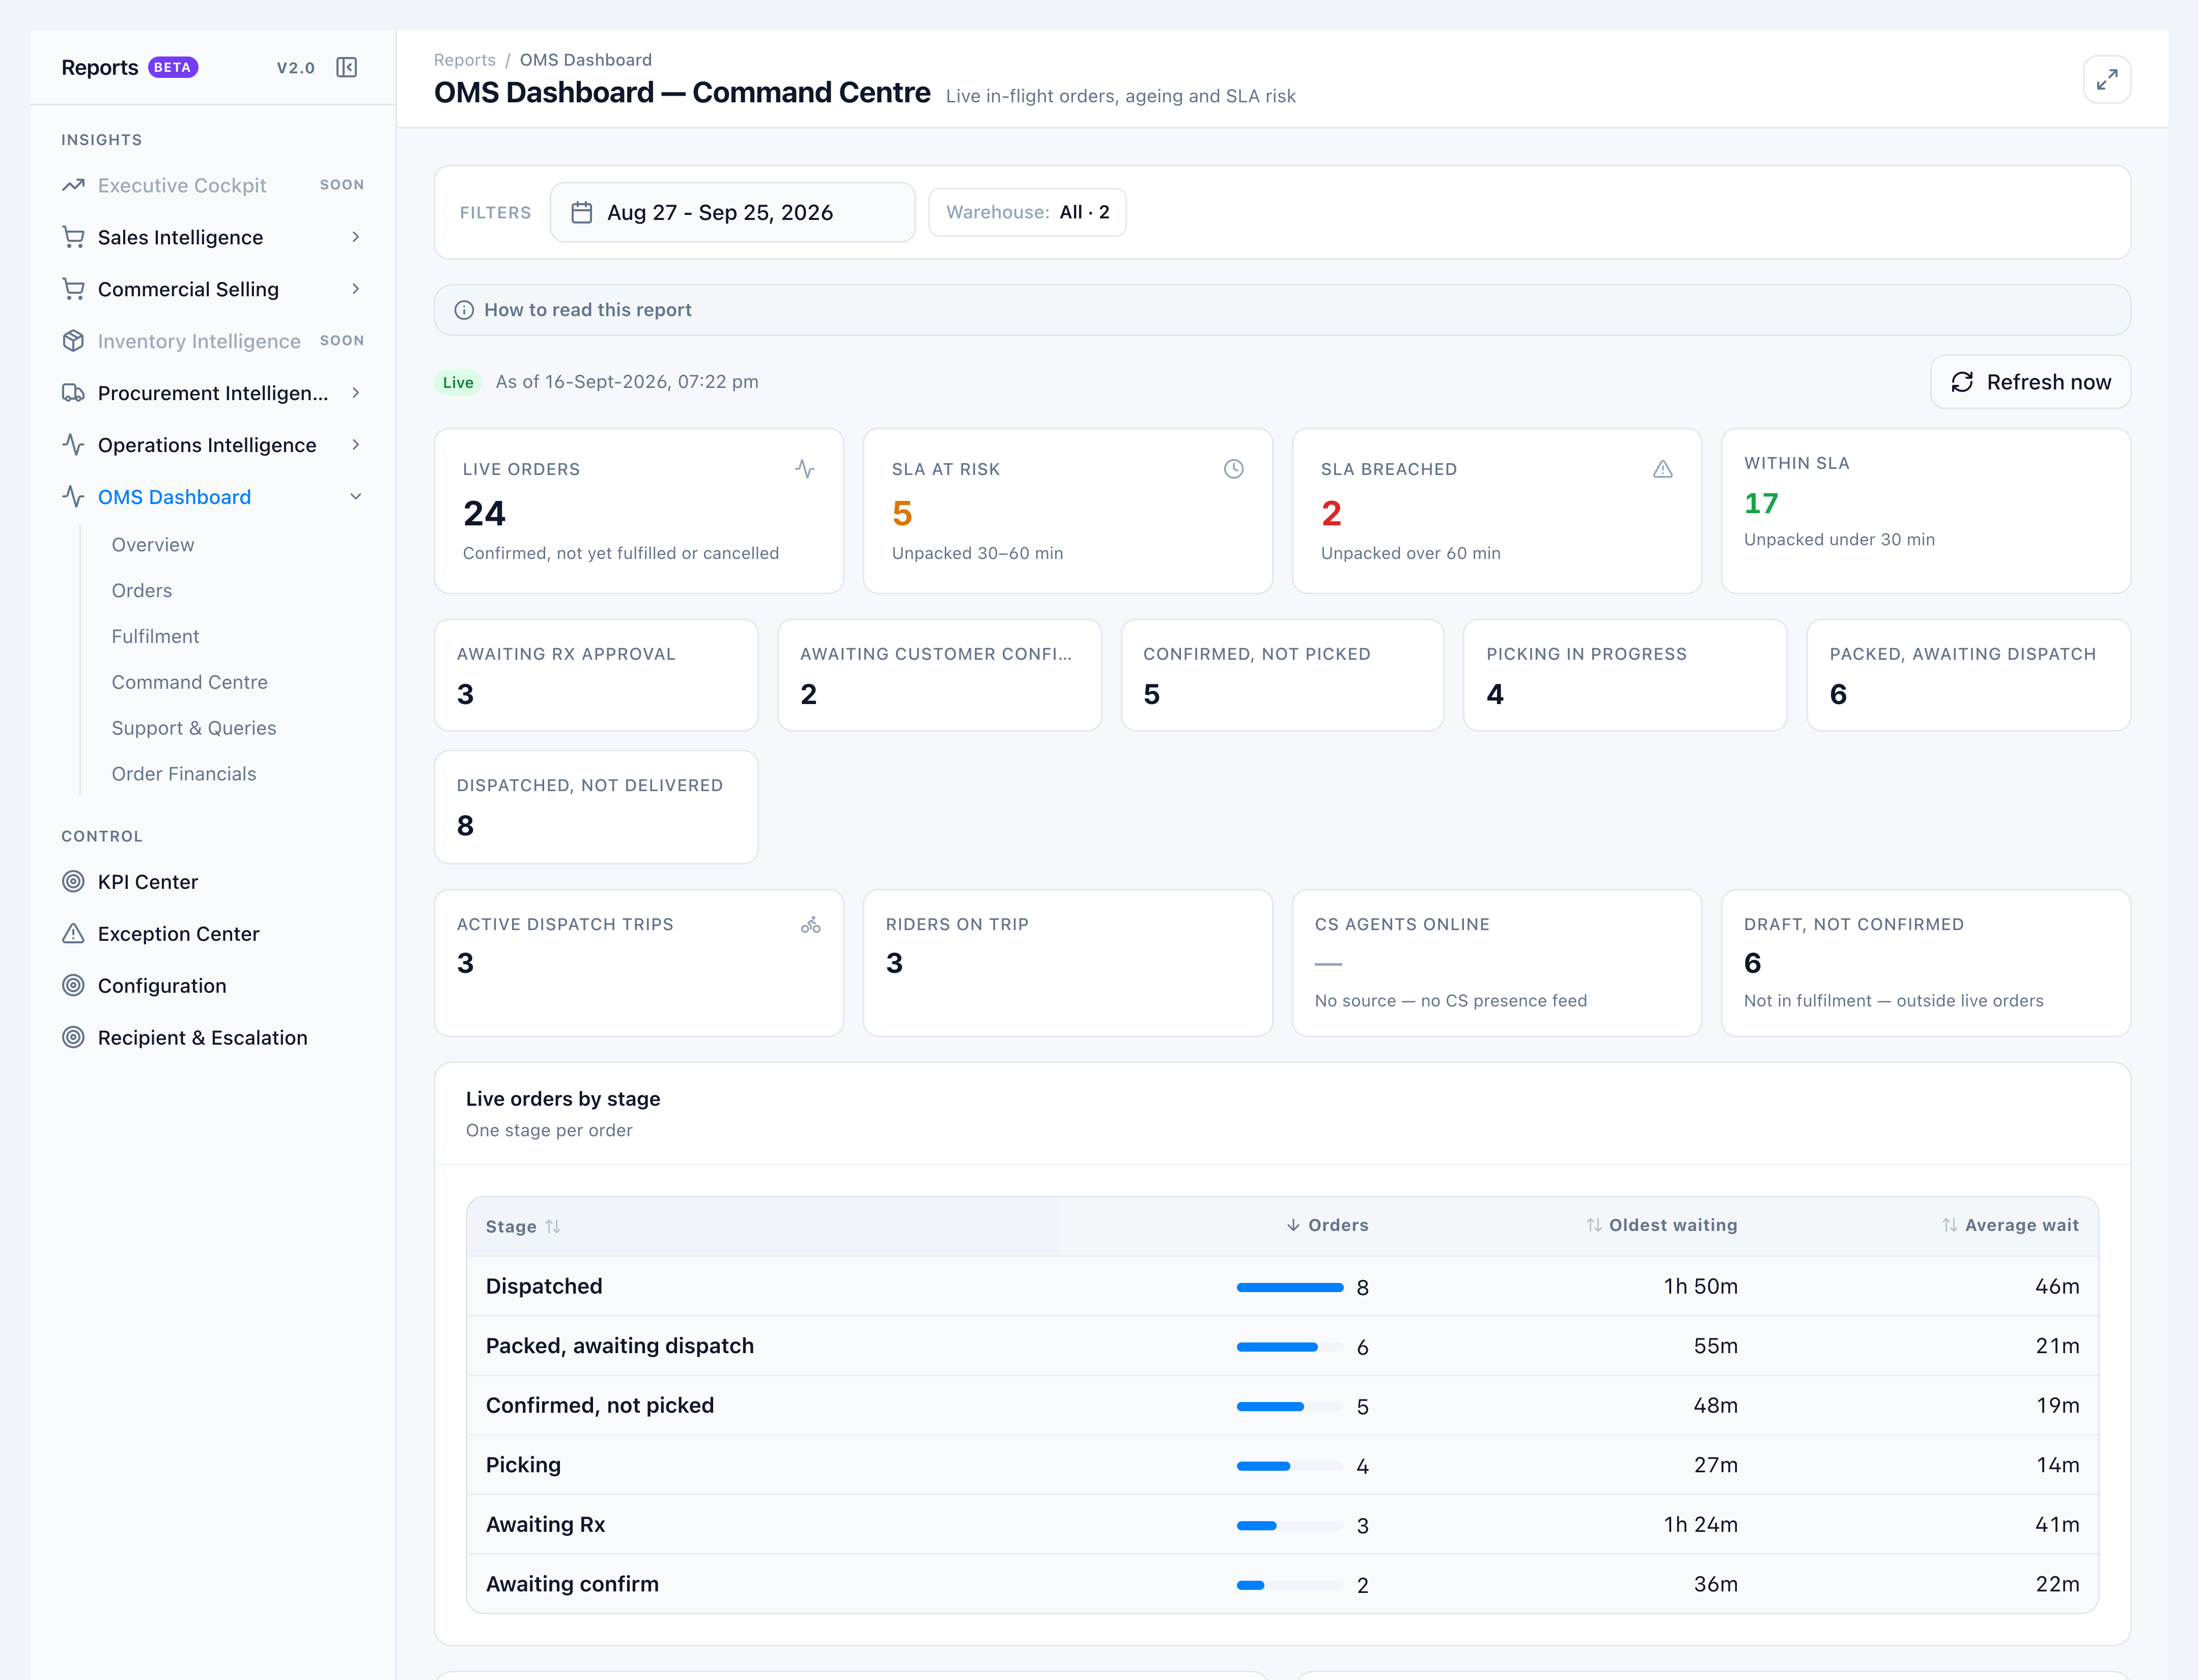
Open Command Centre. Live orders, SLA at risk, and SLA breached must match Overview. Changing the date range does not change those tiles — they are as-of-now and refresh every 30 seconds.
Draft, not confirmed sits outside live orders.
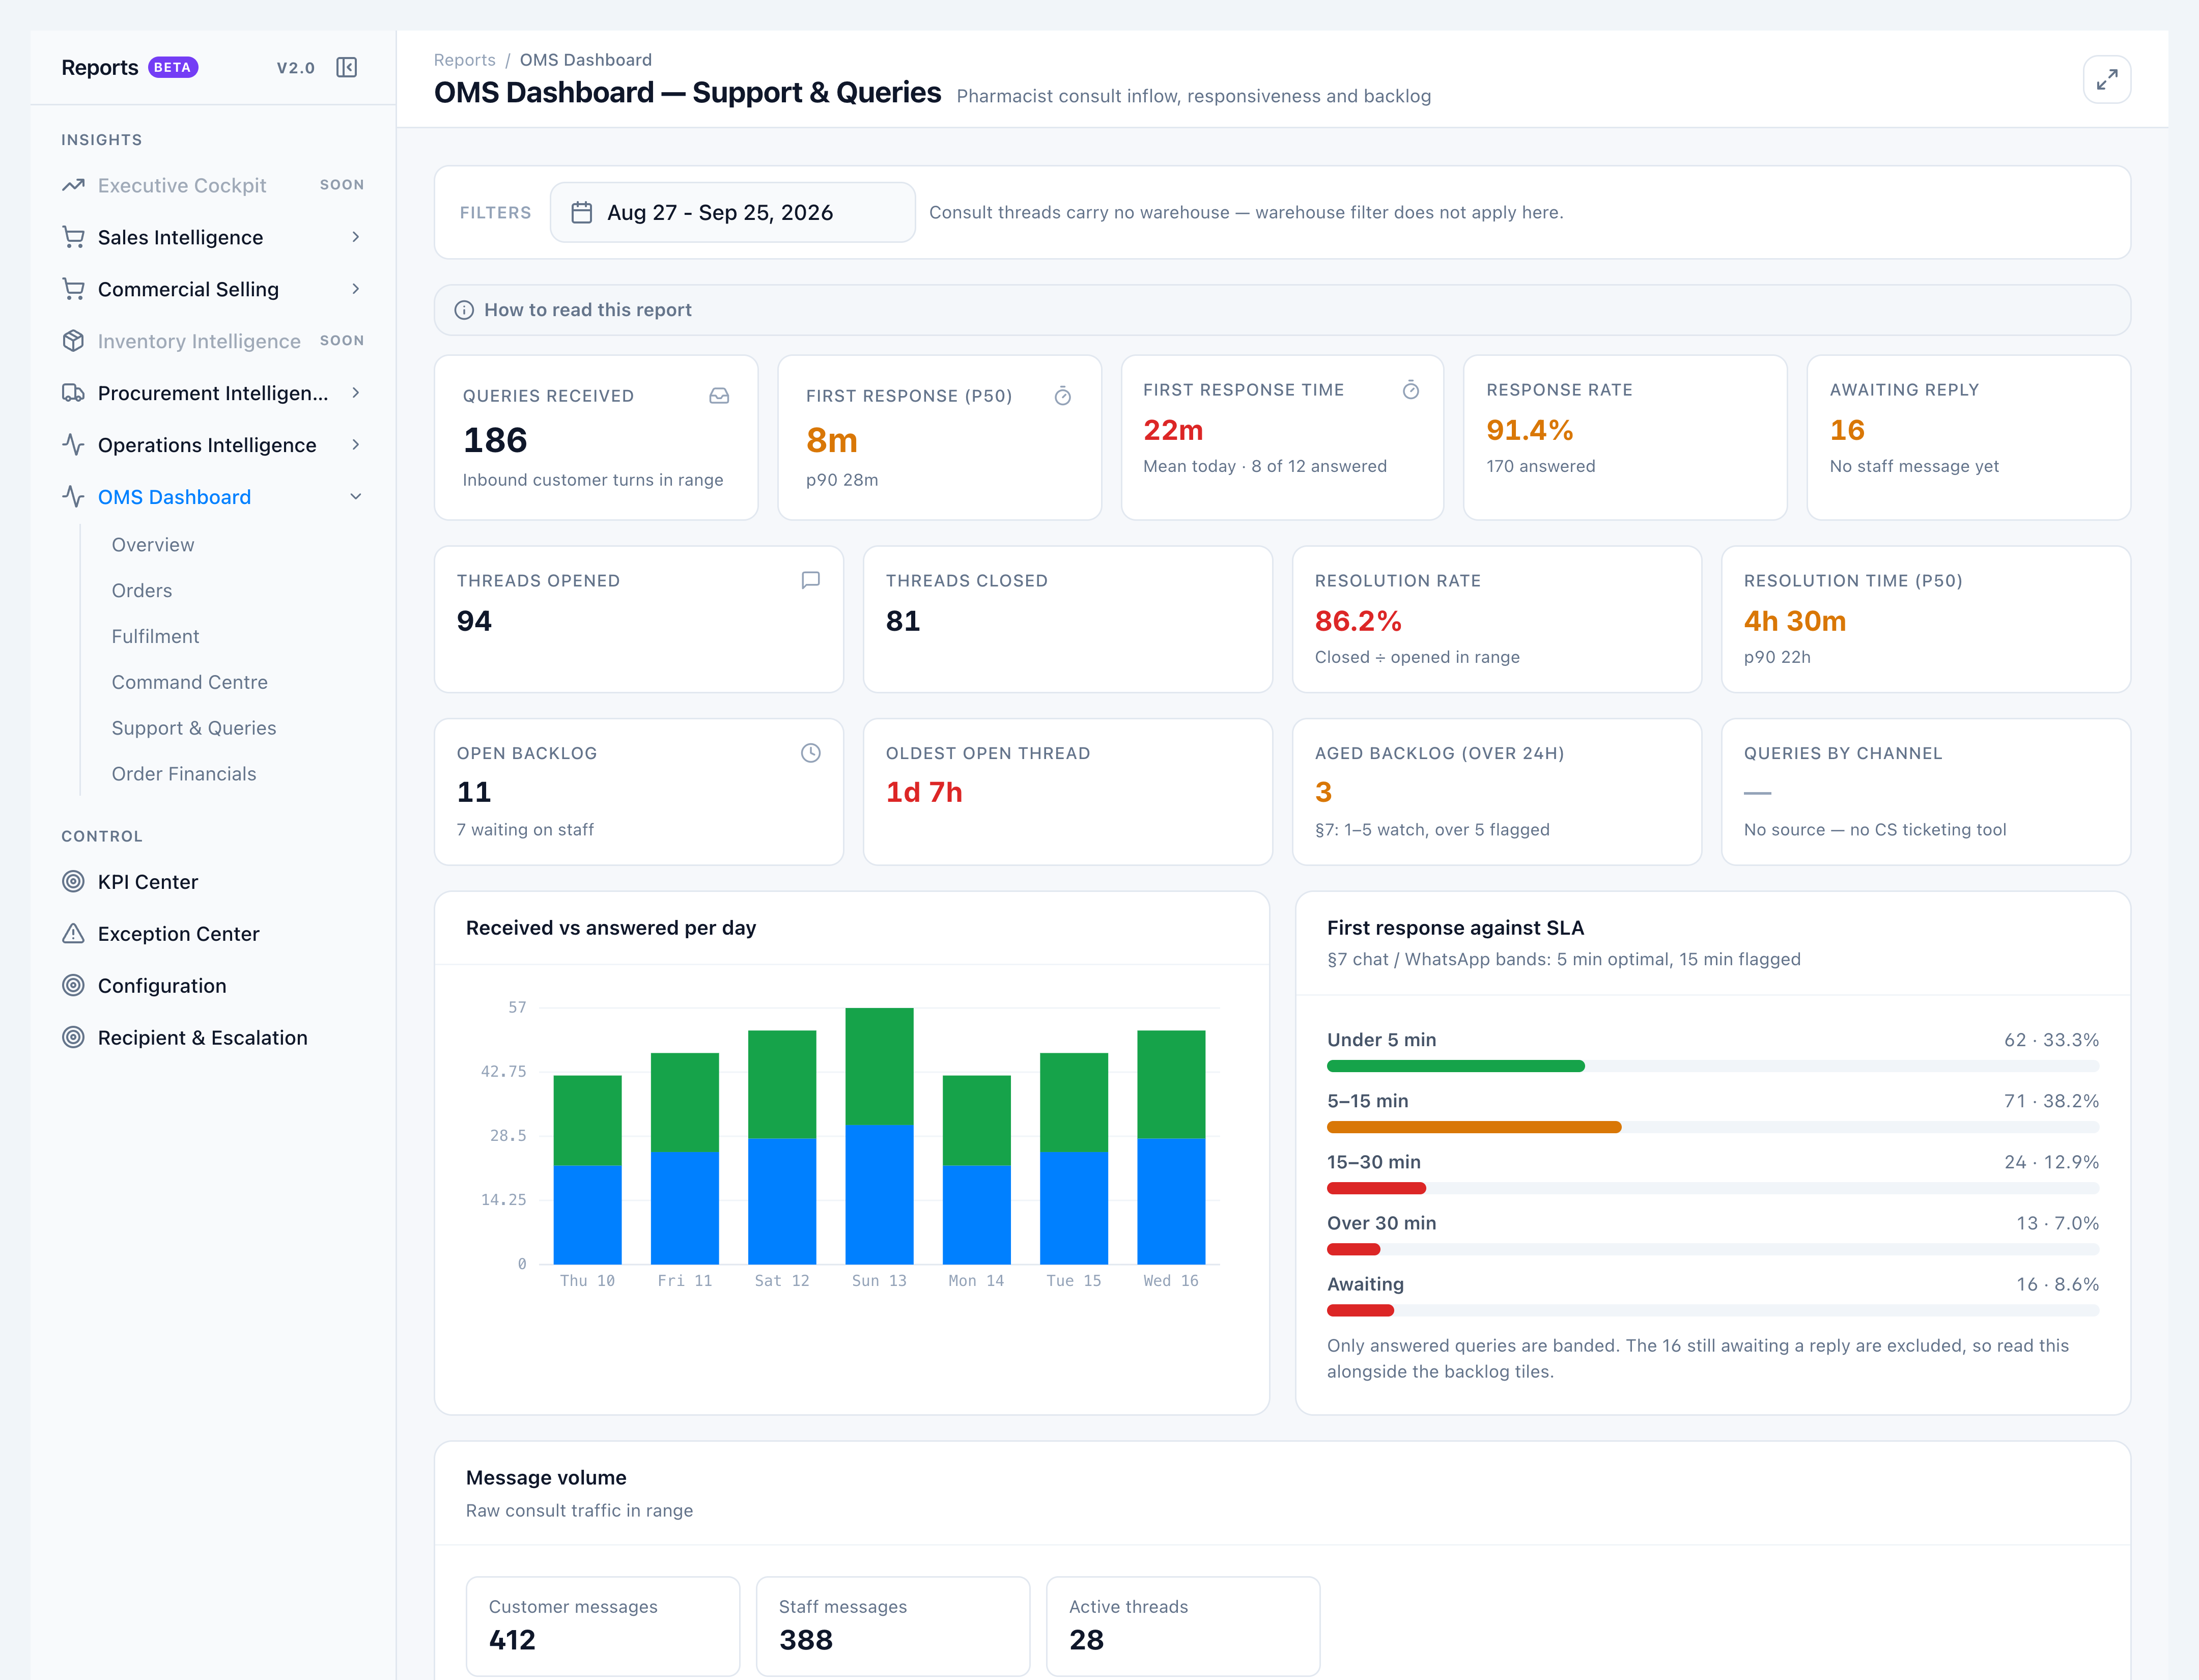
5. Check consult speed on Support & Queries
Open Support & Queries. The warehouse chip is hidden — consult threads have no warehouse.
Open backlog matches Overview Open consult queries. First response time is the mean for queries received today and must match Overview.
6. Read booked vs delivered value
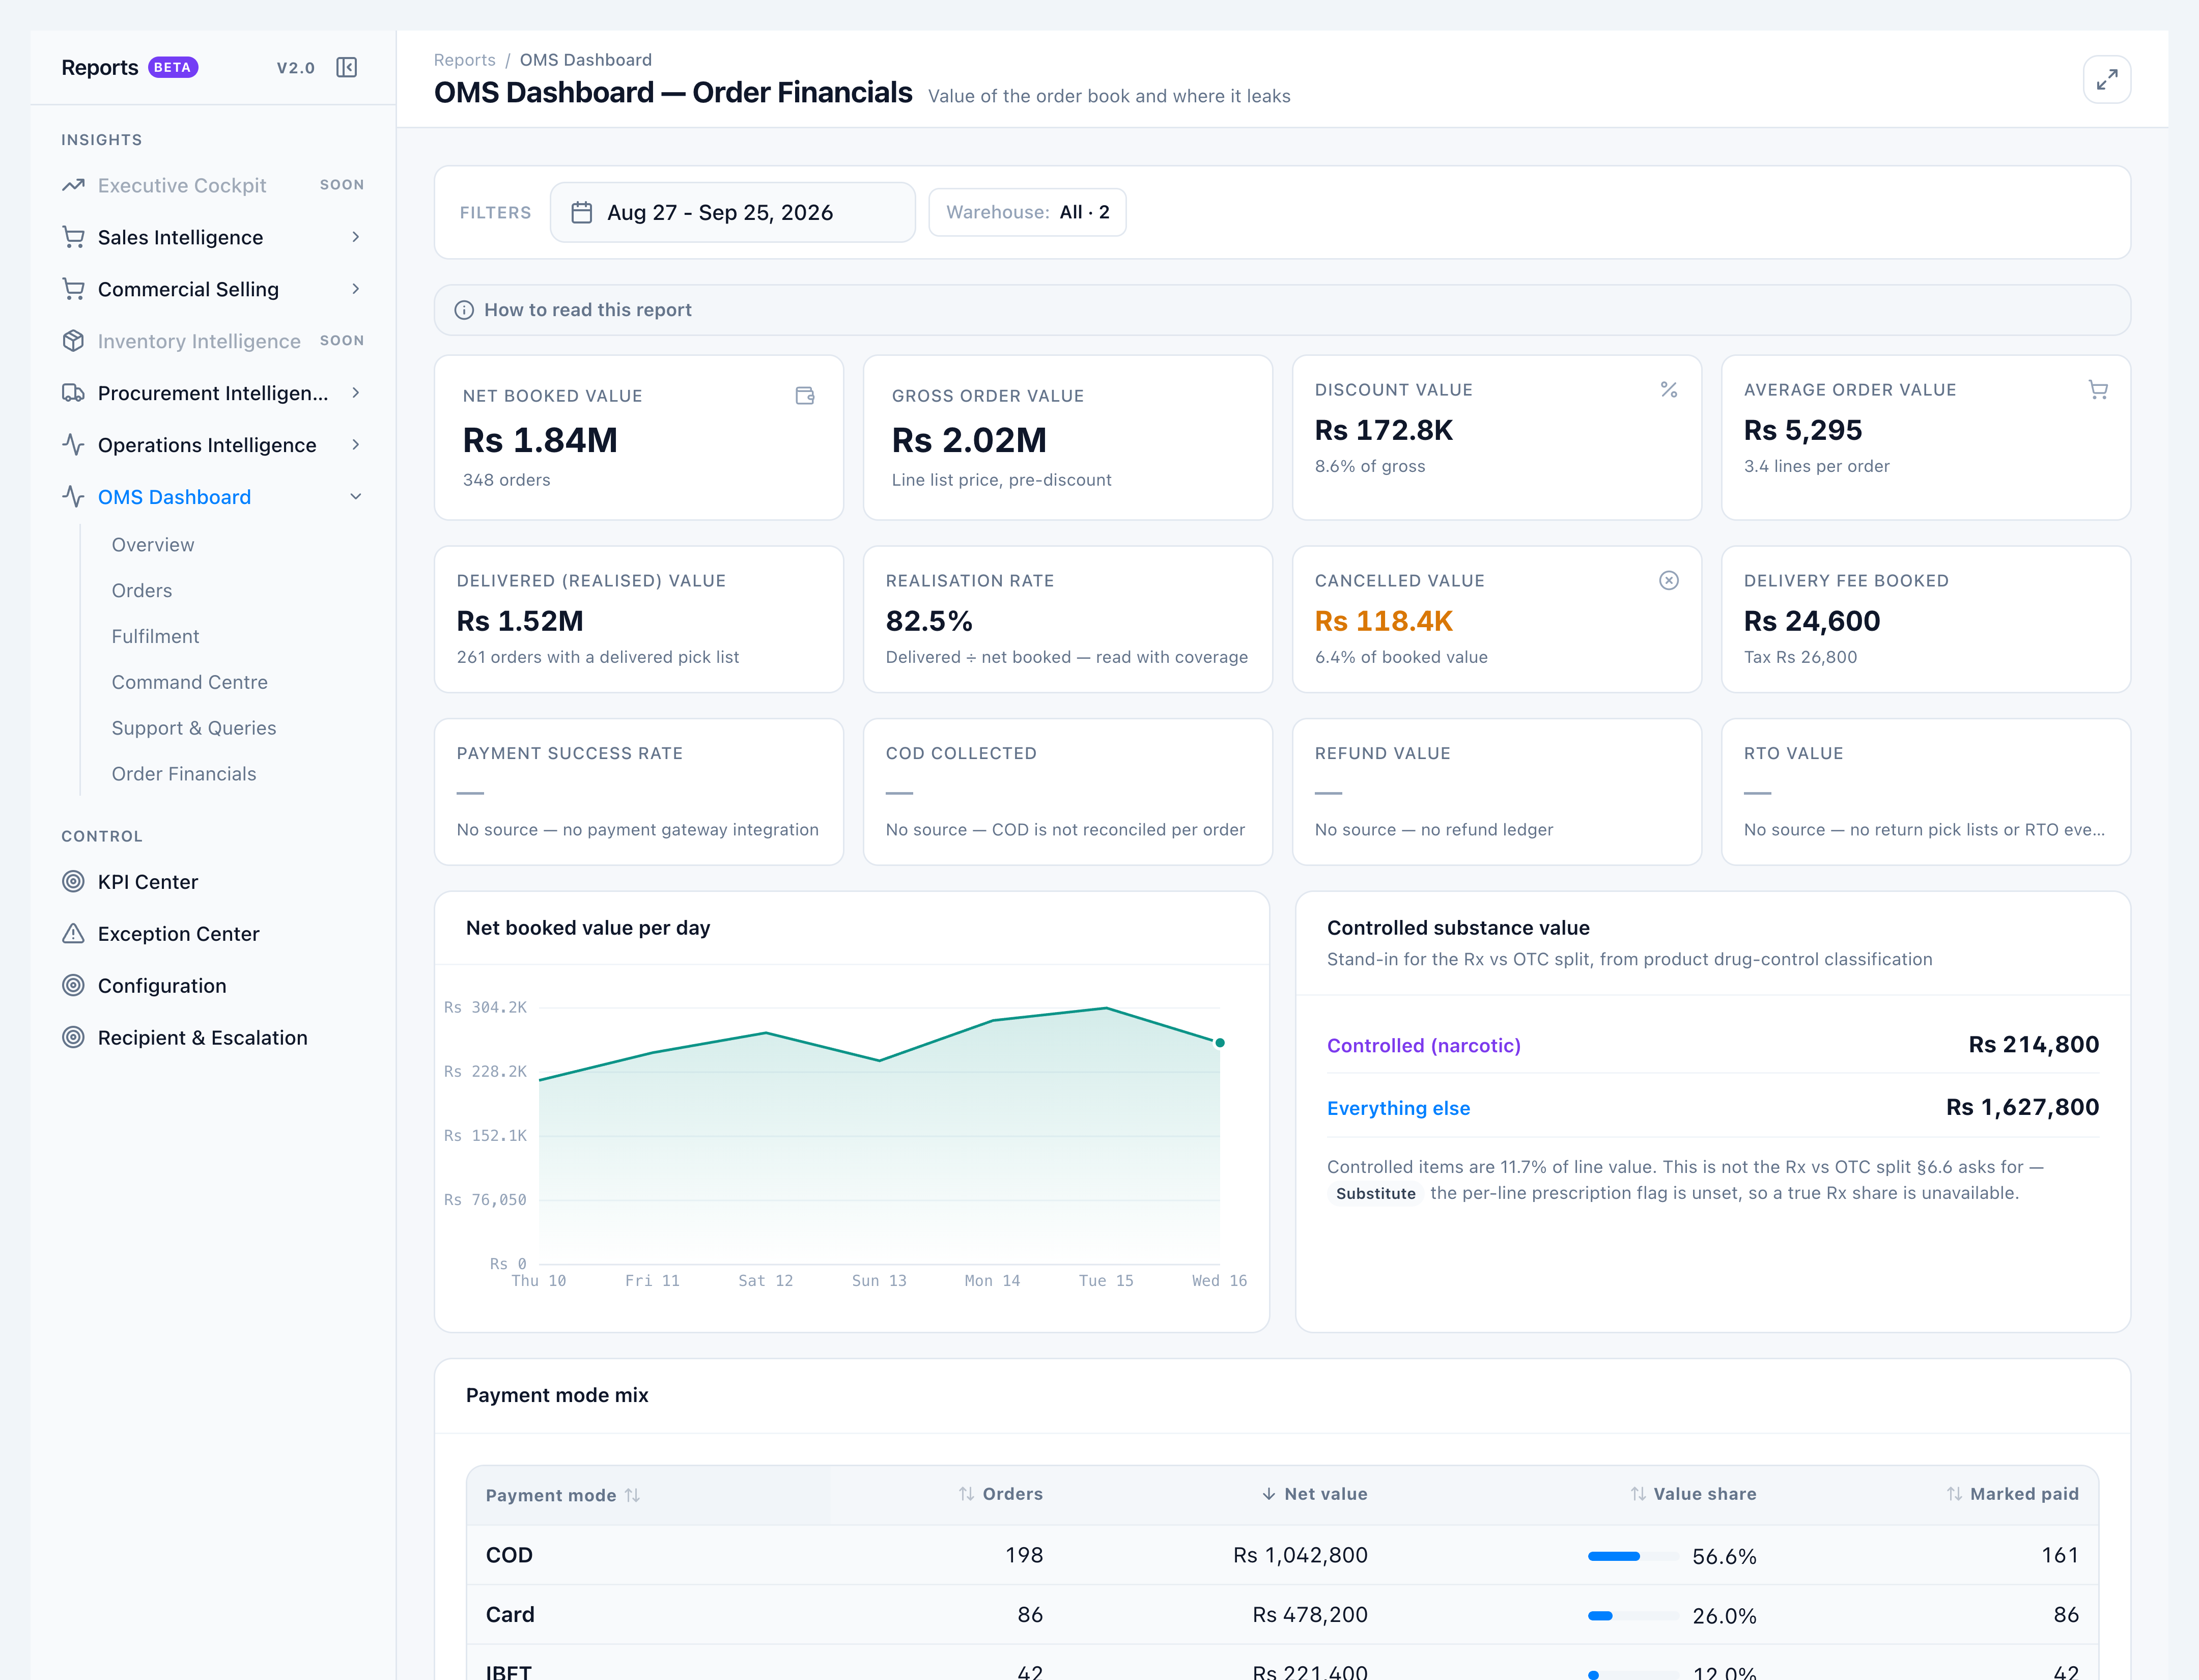
If your role has View OMS Dashboard - Order Financials, open Order Financials.
Net booked value = Gross order value − Discount value, and it must match Overview. Realisation rate is delivered value ÷ net booked value.
Payment success, COD collected, refunds, and RTO stay blank — those ledgers do not exist yet.
You have now walked the full dashboard. For one tab in isolation, use the matching how-to. For exact definitions, see KPI definitions.